← Back to library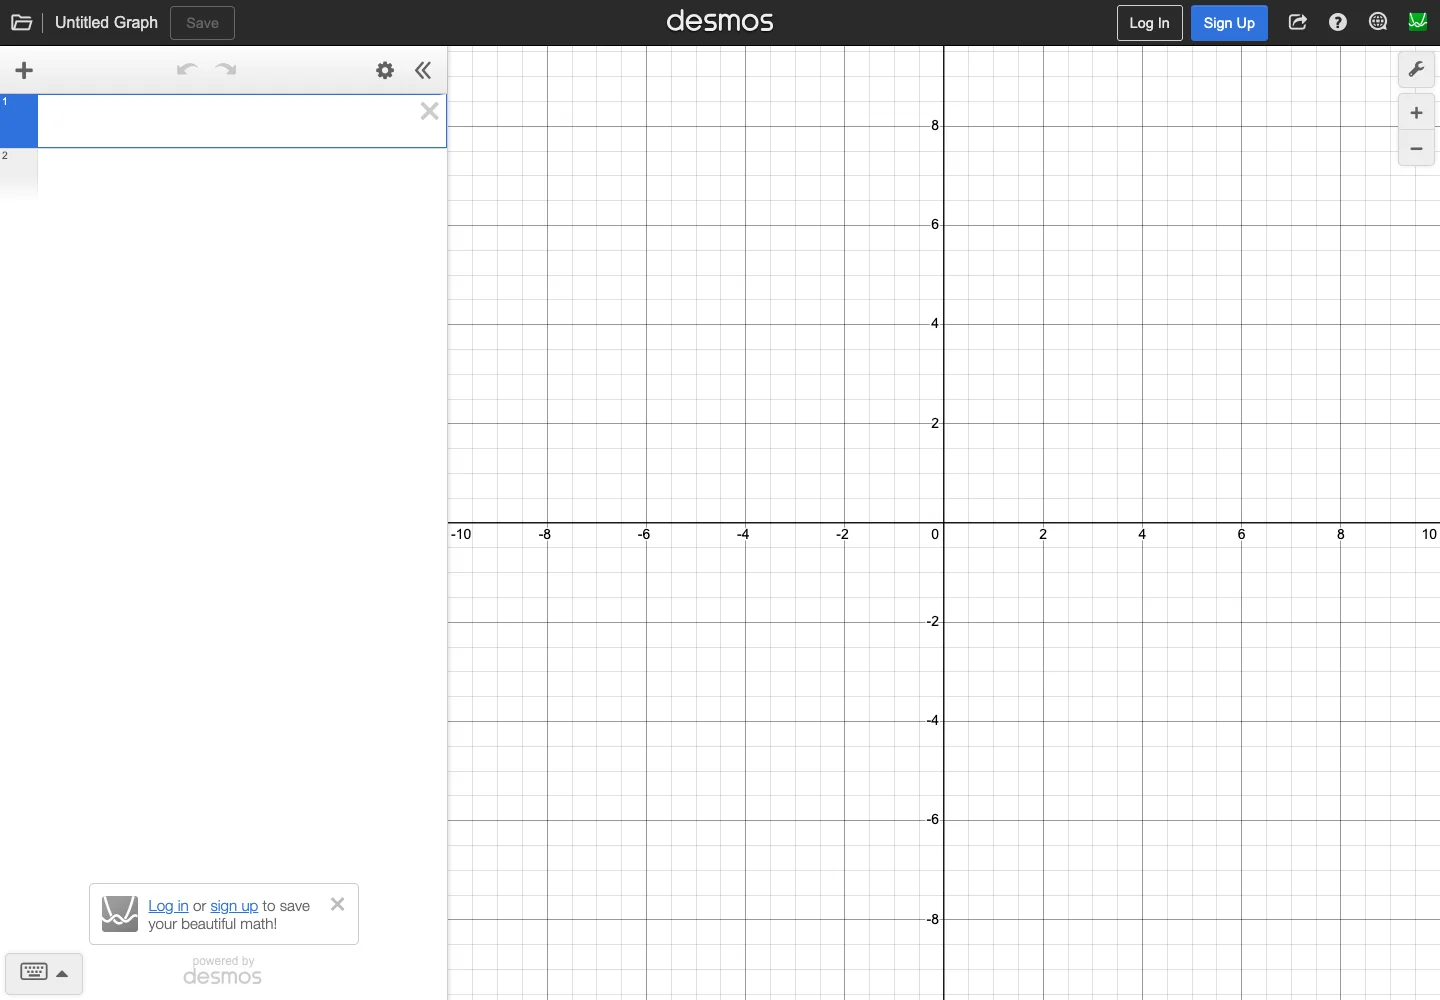
Page excerpt · scroll inside to explore Assembled in your browser. No API key or AI request needed. Changing the fields refreshes the preview.
Desmos — Graphing calculator
Maps & SearchSee it livedesmos.com
A graphing calculator pairs a formula list with a large interactive plot.
Why this pattern works
Align editable expressions with their visual results and preserve canvas space.
Design notes
- Surface
- Graphing calculator
- Navigation
- Graph and account actions occupy the top bar; graph tools stay near the plot.
- Layout
- A formula-entry panel sits beside a large coordinate grid.
- Density
- Use consistent spacing within repeated information so headings, values, and secondary details remain easy to compare.
- Color
- White surfaces, gray grid lines, and dark axis labels.
- Type
- Use a clear type hierarchy for the page title, primary content, and supporting labels.
- Pattern
- Align editable expressions with their visual results and preserve canvas space.
- States
- Initial graph with an empty expression field; no equation is entered.
- Don't
- Do not copy brand assets or sample records. Preserve keyboard access and design empty, loading, and error states for the actual task.
Make it your own
Turn this reference into a useful brief for your project. Copy it into the AI tool you already use.