← Back to library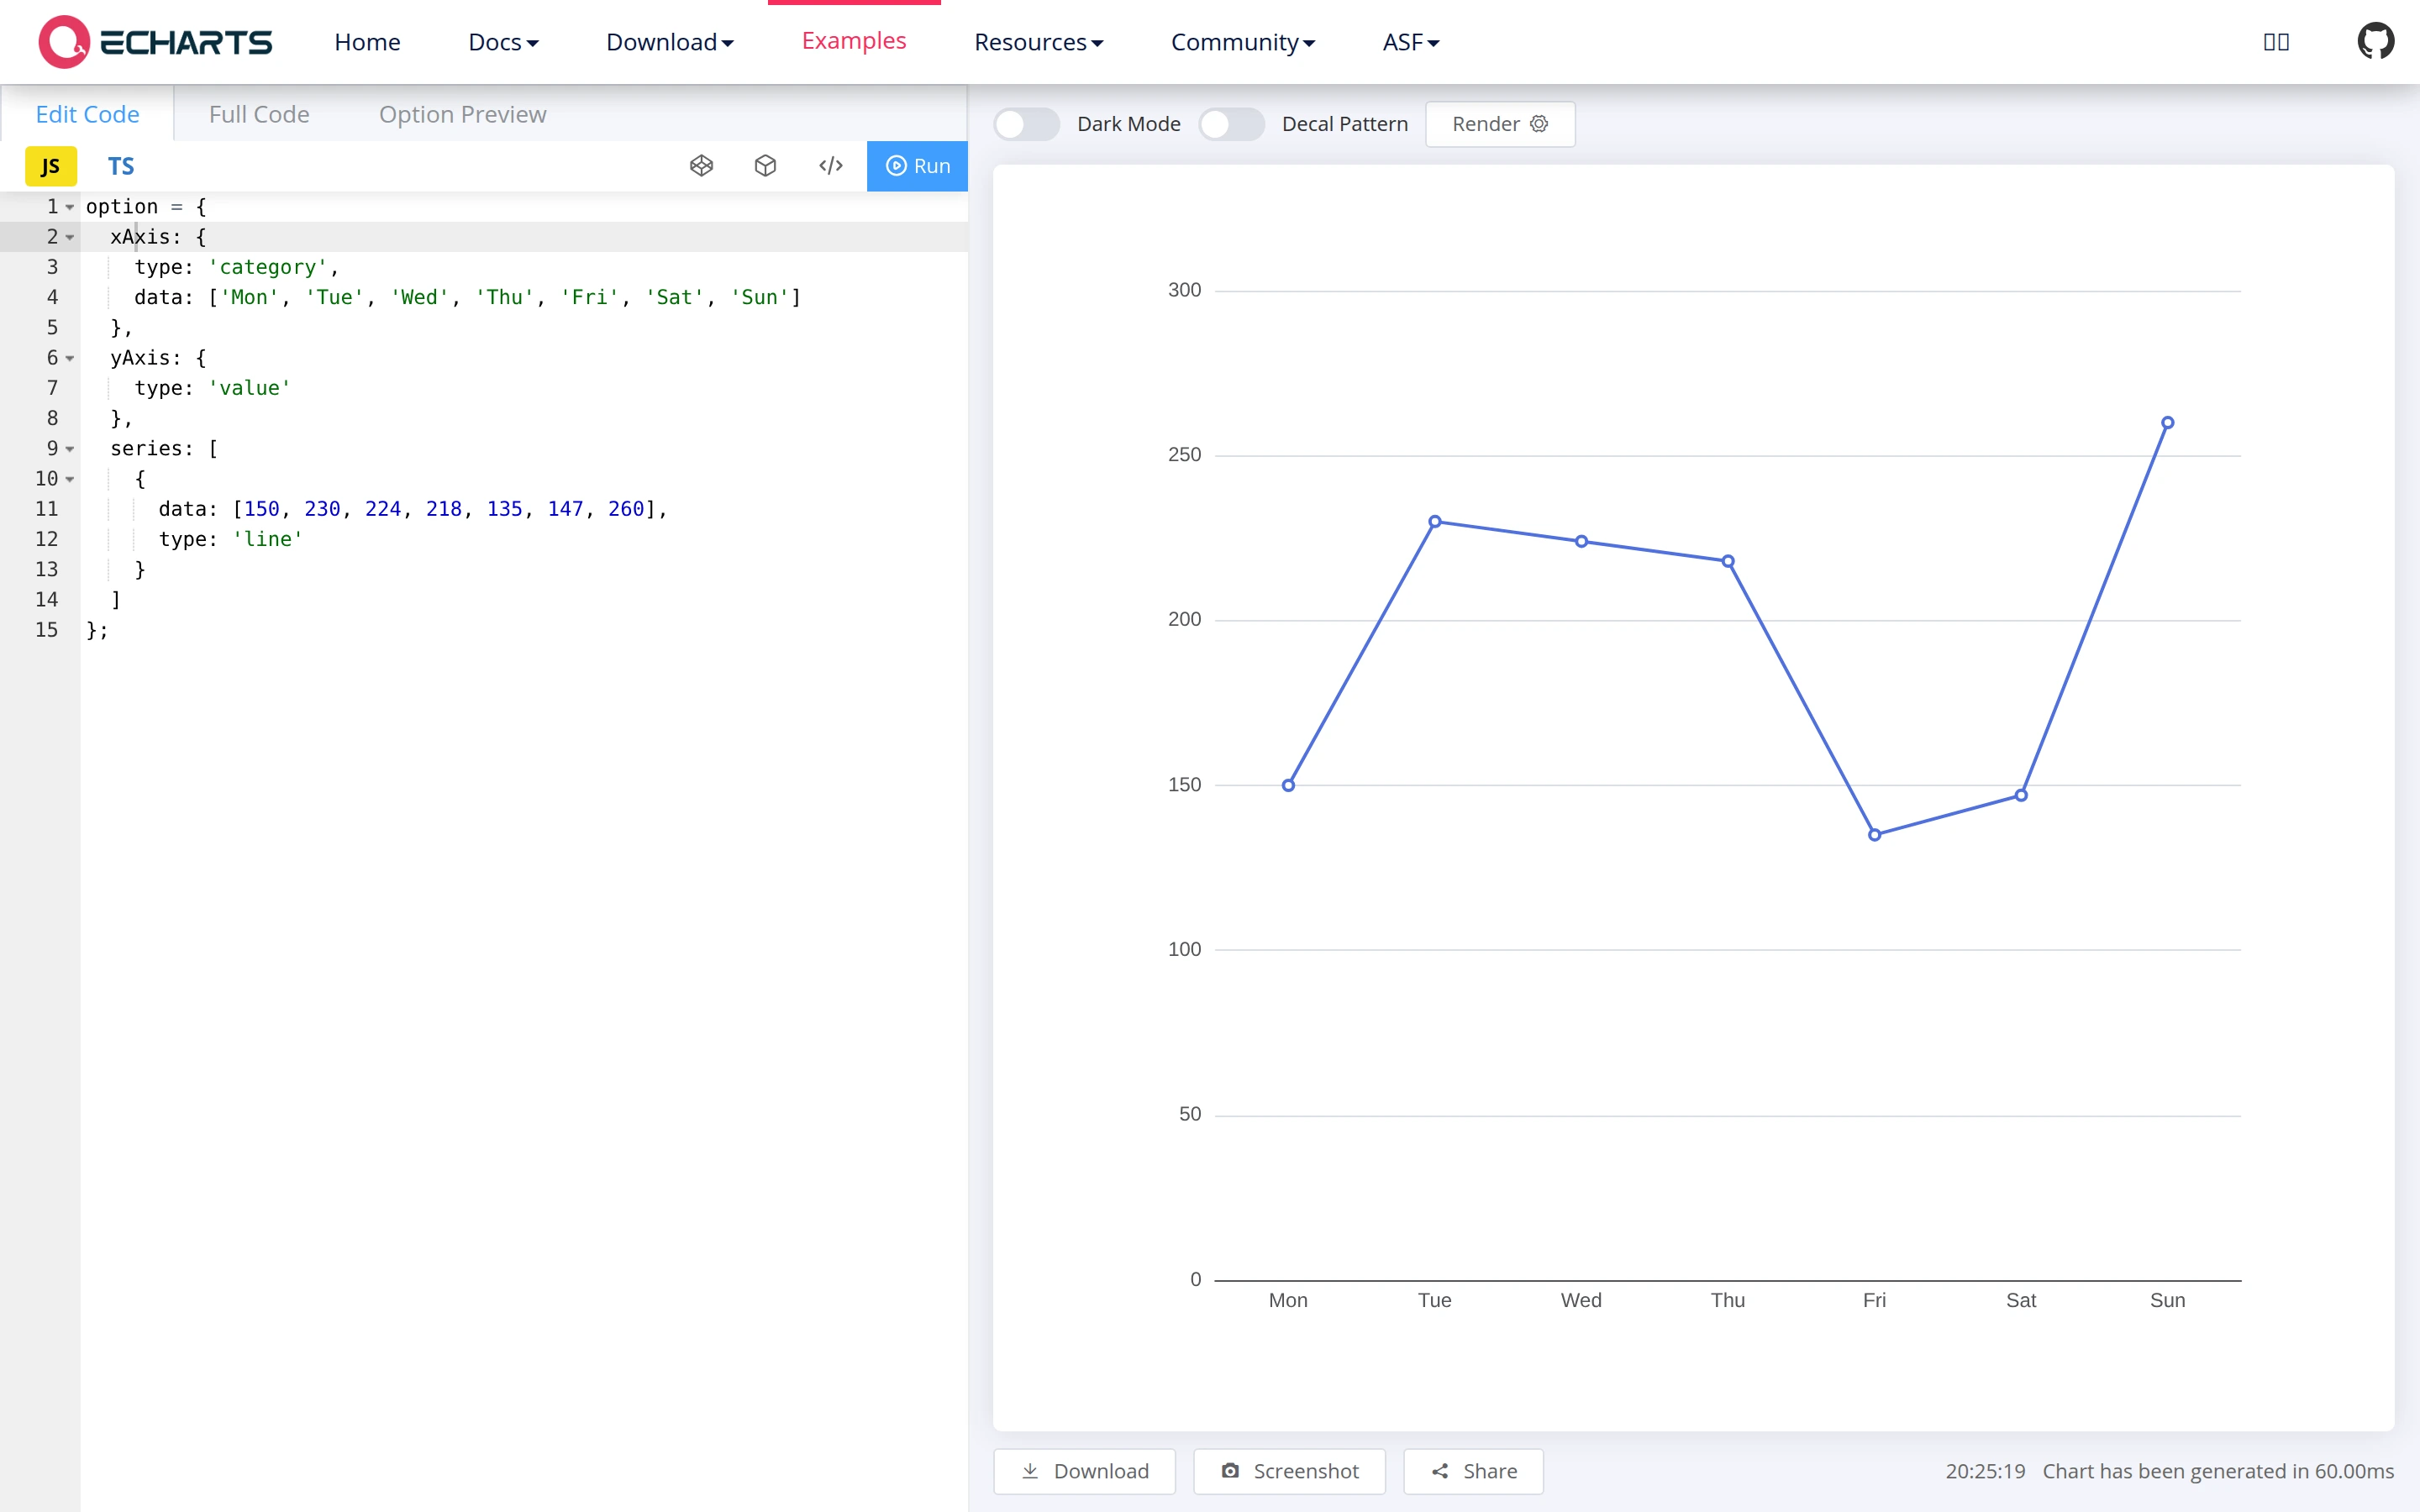
Viewport capture · opening screen Assembled in your browser. No API key or AI request needed. Changing the fields refreshes the preview.
Apache ECharts — Line chart example
Editors & ToolsSee it liveecharts.apache.org
A compact chart configuration editor sits beside a large rendered line chart, linking source data and visible output.
Why this pattern works
A compact chart configuration editor sits beside a large rendered line chart, linking source data and visible output.
Design notes
- Surface
- Apache ECharts — Line chart example
- Navigation
- Code on the left and a broad chart preview on the right.
- Layout
- Code on the left and a broad chart preview on the right.
- Density
- A large main workspace is supported by compact task controls.
- Color
- White, pale gray and blue
- Type
- Small utility labels keep the visual workspace dominant.
- Pattern
- A compact chart configuration editor sits beside a large rendered line chart, linking source data and visible output.
- States
- Public built-in example as captured; sample content is demonstration data.
- Don't
- Use the layout as a reference with your own content and identity. The still does not verify interactive behavior.
Make it your own
Turn this reference into a useful brief for your project. Copy it into the AI tool you already use.