← Back to library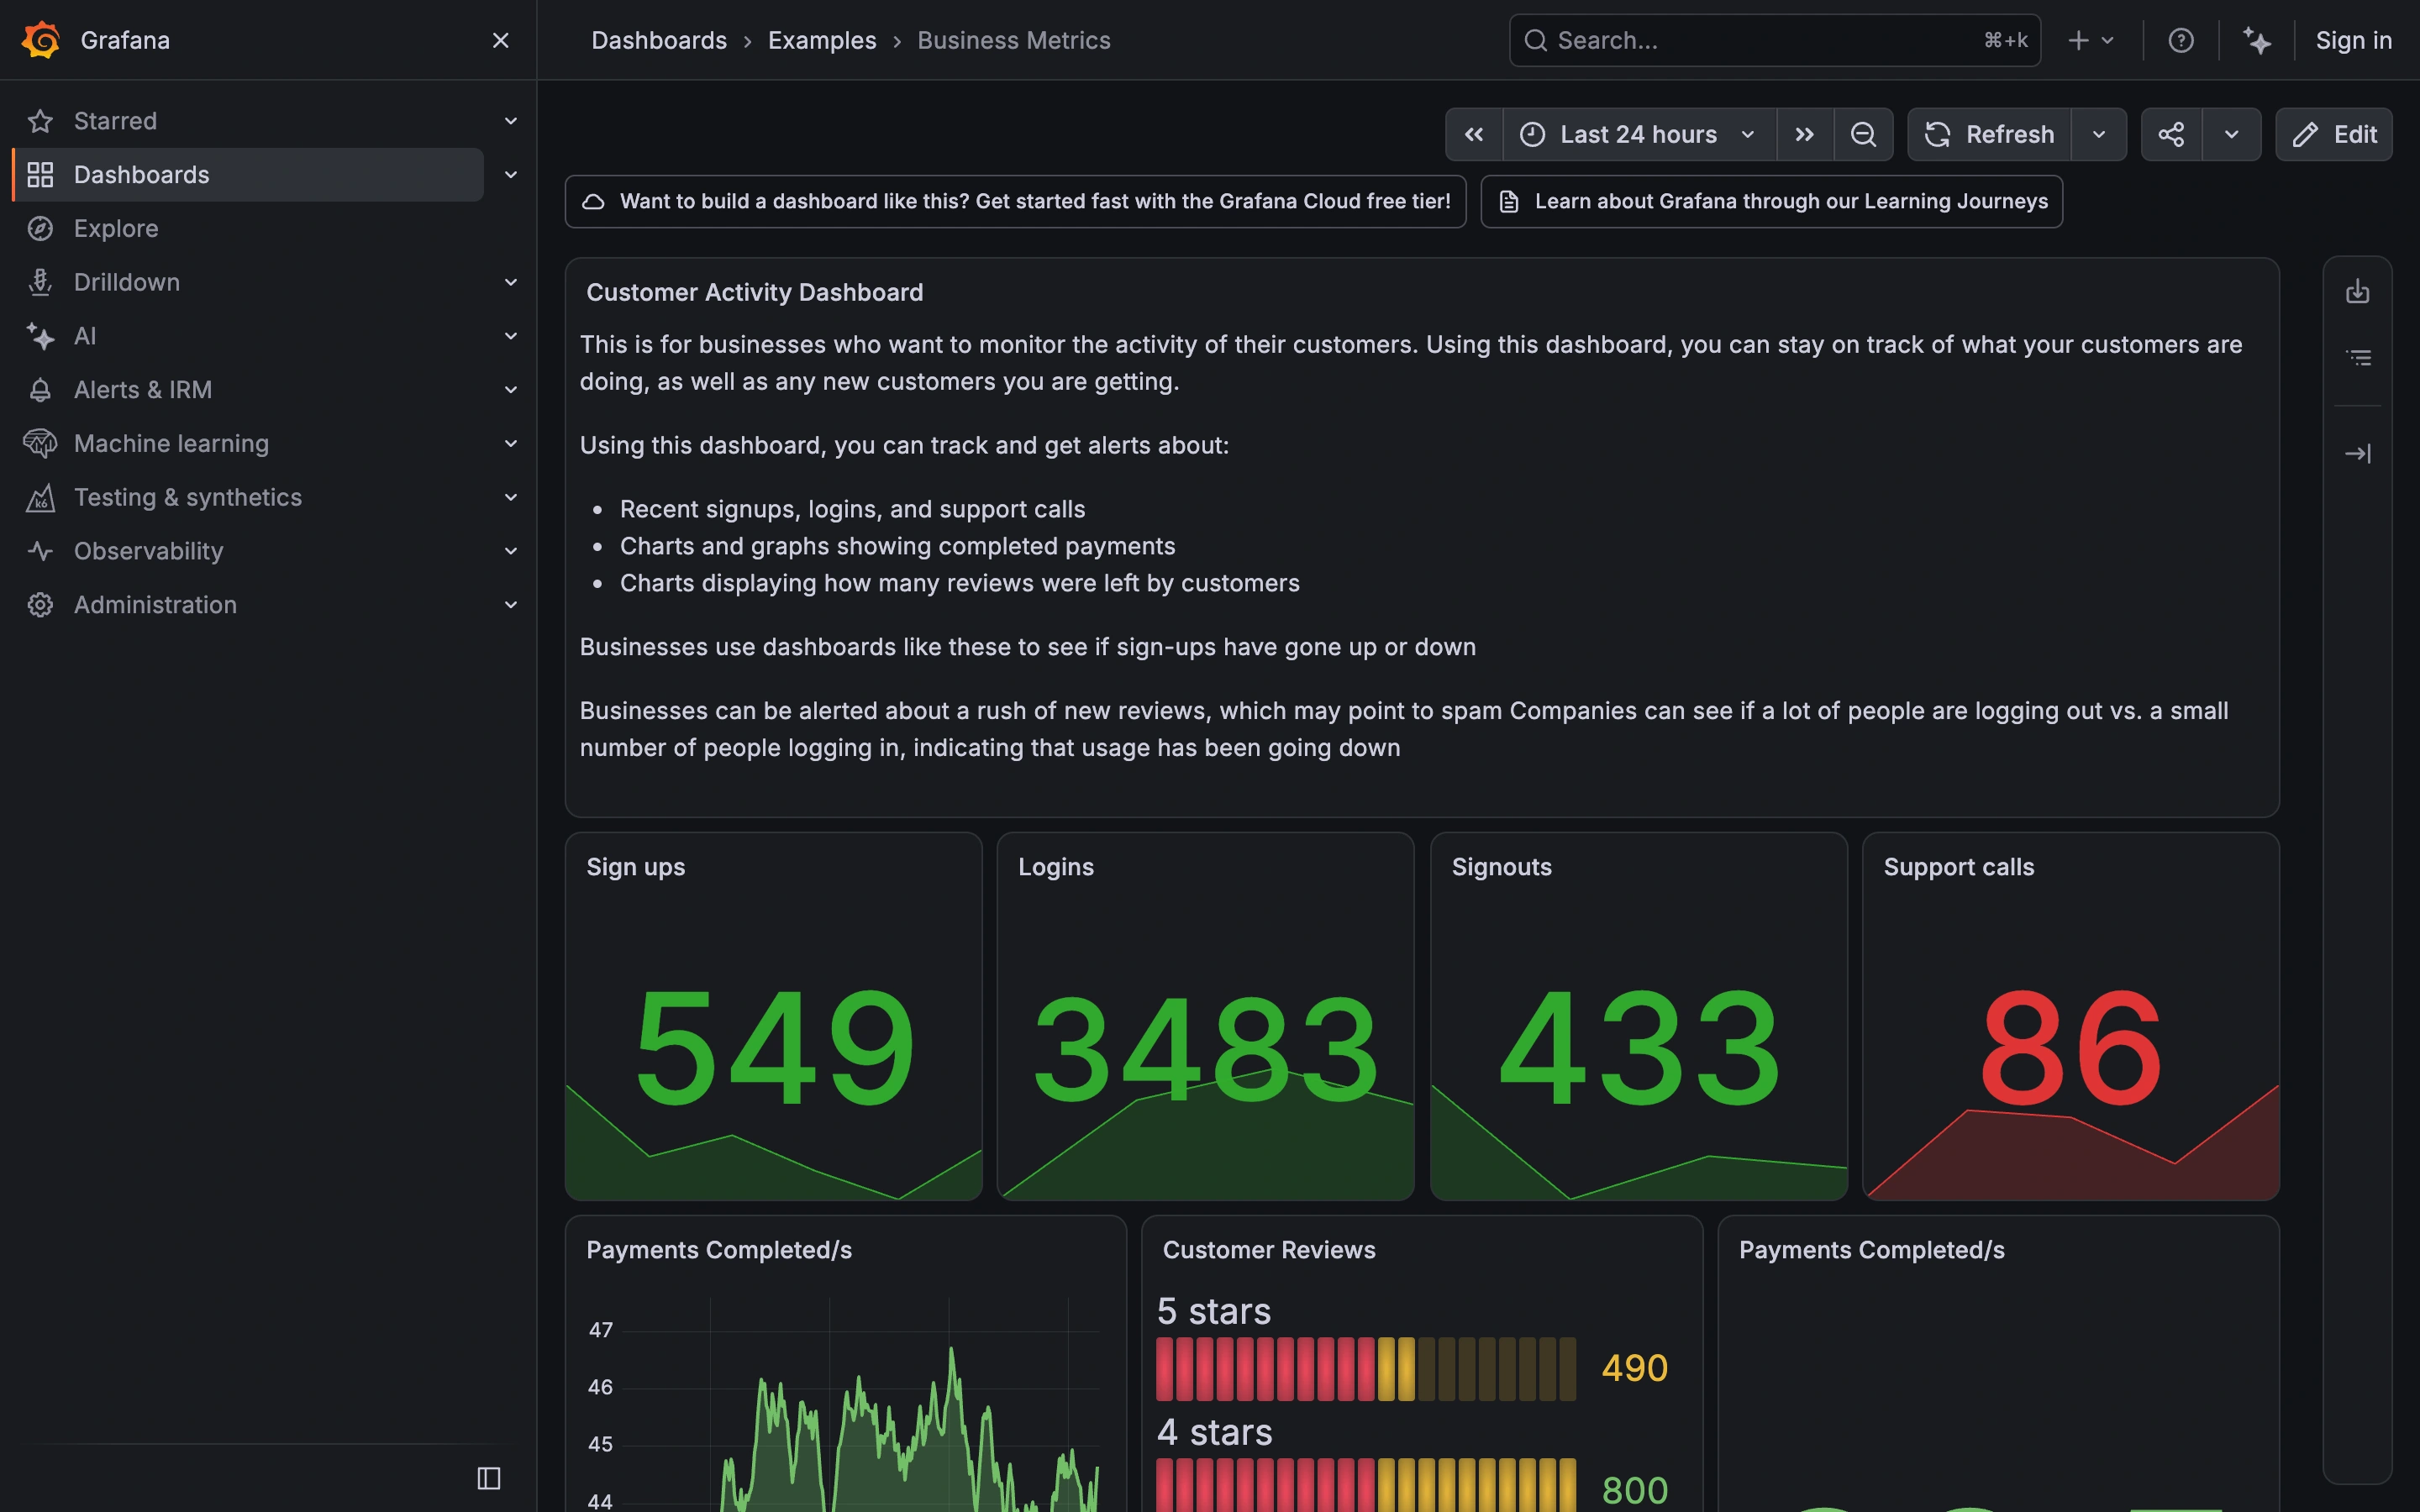
Viewport capture · opening screen Assembled in your browser. No API key or AI request needed. Changing the fields refreshes the preview.
Grafana — Business metrics
Analytics DashboardSee it liveplay.grafana.org
A dark public demo dashboard combines an explanatory panel, oversized activity metrics, and supporting time-series and review charts.
Why this pattern works
Operational dashboards that need context alongside several distinct metric types.
Design notes
- Surface
- Grafana Play public Business Metrics demo dashboard.
- Navigation
- Persistent product sidebar with breadcrumbs and a shared time-range and refresh toolbar.
- Layout
- Introductory panel above a row of large statistics and smaller chart panels.
- Density
- High, organized into clearly bounded panels.
- Color
- Charcoal surfaces, subtle gray borders, green metrics, red exception value, multicolor chart accents.
- Type
- Compact interface labels and oversized numerical indicators.
- Pattern
- Apply one date context to a grid of metrics while using text panels to explain how to interpret them.
- States
- Populated public demo; sample values and time windows can change.
- Don't
- Do not rely only on red and green or display large numbers without context and units.
Make it your own
Turn this reference into a useful brief for your project. Copy it into the AI tool you already use.