← Back to library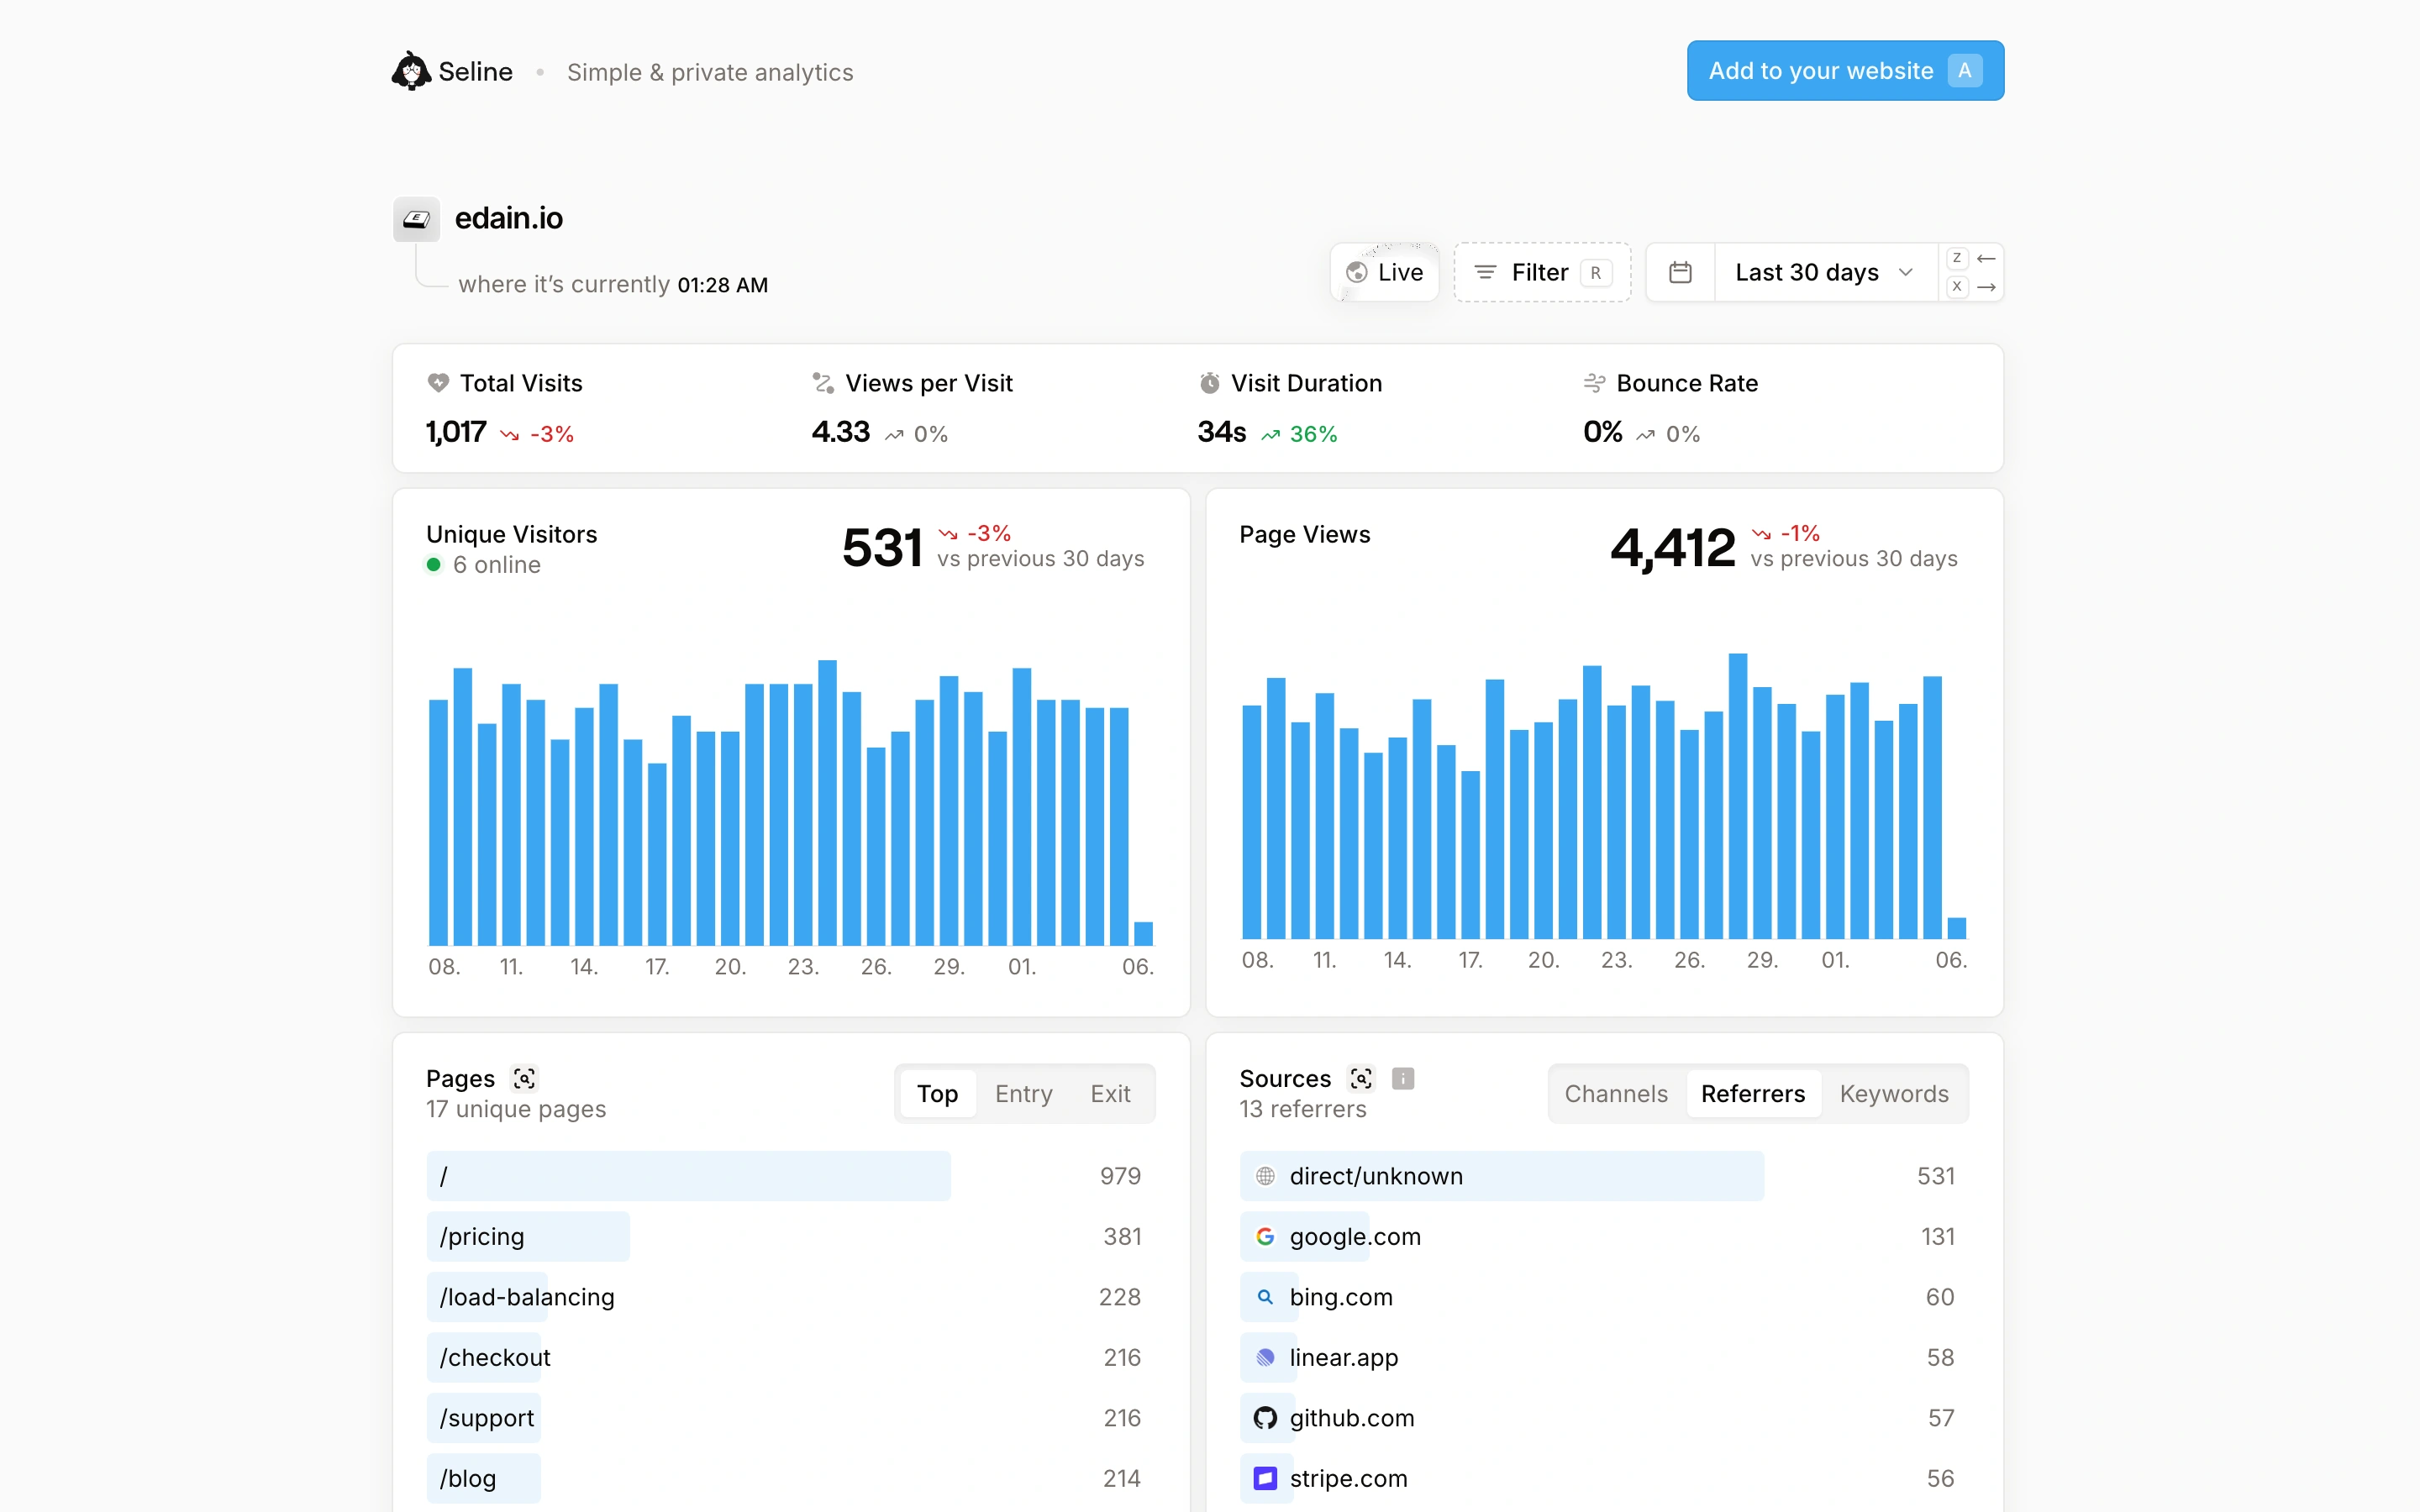
Viewport capture · opening screen Assembled in your browser. No API key or AI request needed. Changing the fields refreshes the preview.
Seline — Shared analytics
Analytics DashboardSee it liveapp.seline.com
A shared analytics page combines headline metrics, blue traffic charts, and compact source and page breakdowns with lightweight filtering.
Why this pattern works
Shareable analytics views that should remain readable without the full product navigation.
Design notes
- Surface
- Seline public analytics share for edain.io.
- Navigation
- Small site identity and date/filter controls; no full account sidebar.
- Layout
- Headline summaries above paired chart panels and tabular breakdowns.
- Density
- Moderate, with aligned values and restrained boundaries.
- Color
- White, pale gray, blue charts and small change indicators.
- Type
- Prominent metric values and compact sans labels.
- Pattern
- Keep shared reports focused on data context, date selection, and the main comparisons.
- States
- Public populated share; values can change and belong to the source website.
- Don't
- Keep the site identity and date range visible when sharing or exporting the view.
Make it your own
Turn this reference into a useful brief for your project. Copy it into the AI tool you already use.