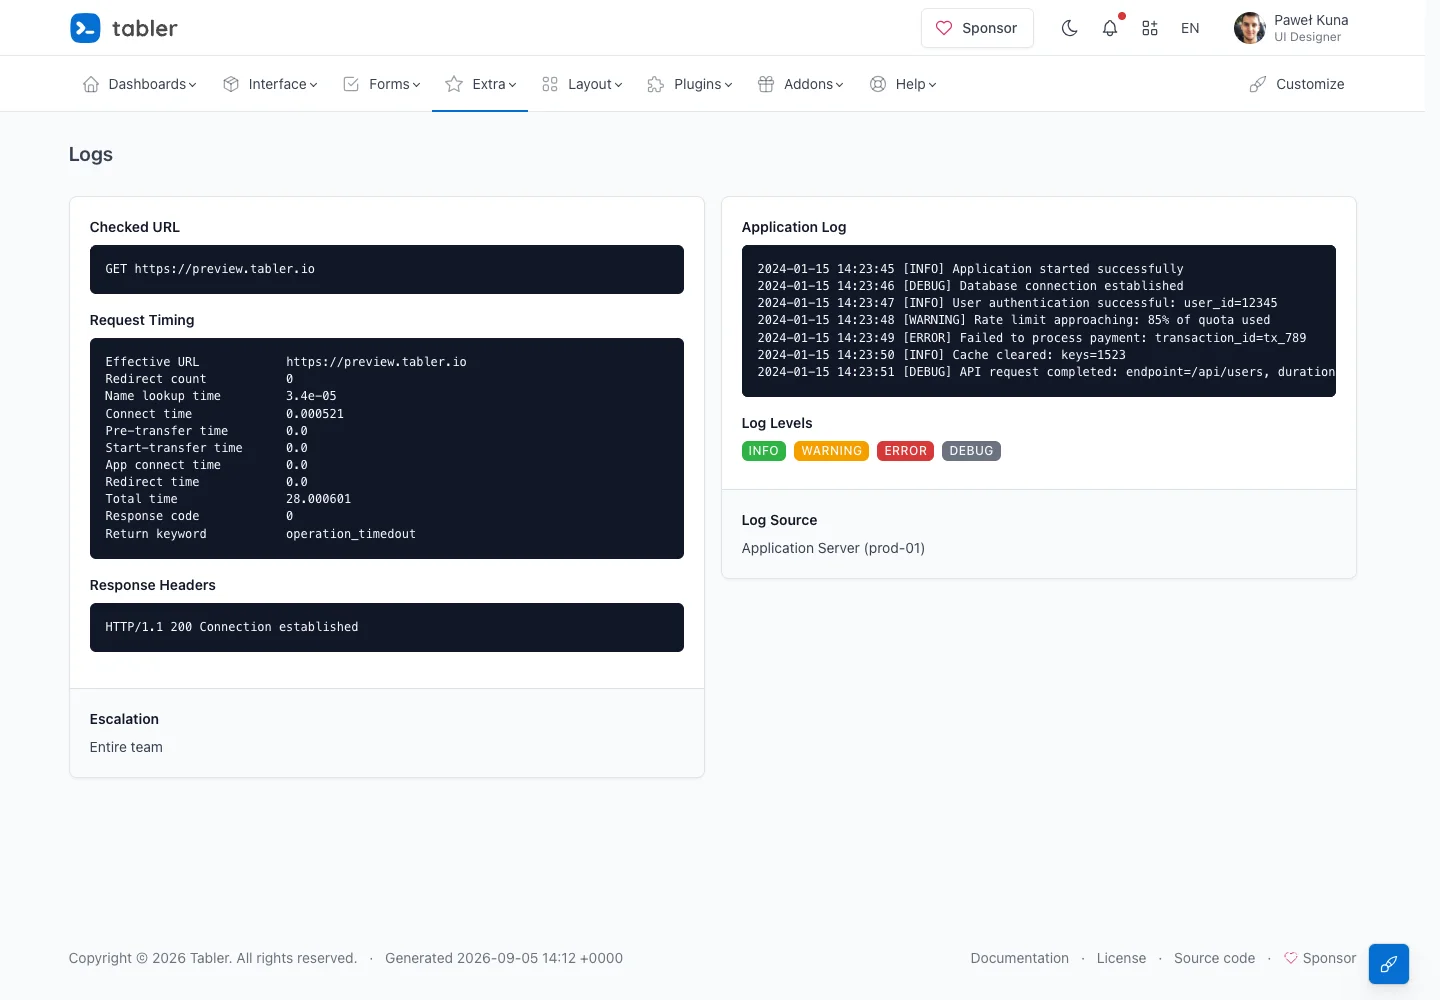
Group technical diagnostics by request and application context so related information stays together.
Design notes
Surface
Request logs
Navigation
The shared app header stays above the diagnostic content.
Layout
Two columns group request URL, timings, headers, application messages, and source details.
Density
Primary content has the most space; repeated rows and secondary navigation use a compact, consistent rhythm.
Color
Dark code panels contrast with a pale workspace; severity labels use distinct colors.
Type
Monospaced log lines contrast with plain-language section labels.
Pattern
Group technical diagnostics by request and application context so related information stays together.
States
Public demo diagnostics with sample request timings and log messages.
Don't
Adapt the interaction pattern to your own product. Do not copy brand assets, sample identities, proprietary text, or assume unseen states. Specify keyboard behavior, loading, empty, error, and narrow-screen layouts for your implementation.
Make it your own
Turn this reference into a useful brief for your project. Copy it into the AI tool you already use.
Add constraintsPreview & edit promptAssembled in your browser. No API key or AI request needed. Changing the fields refreshes the preview.