← Back to library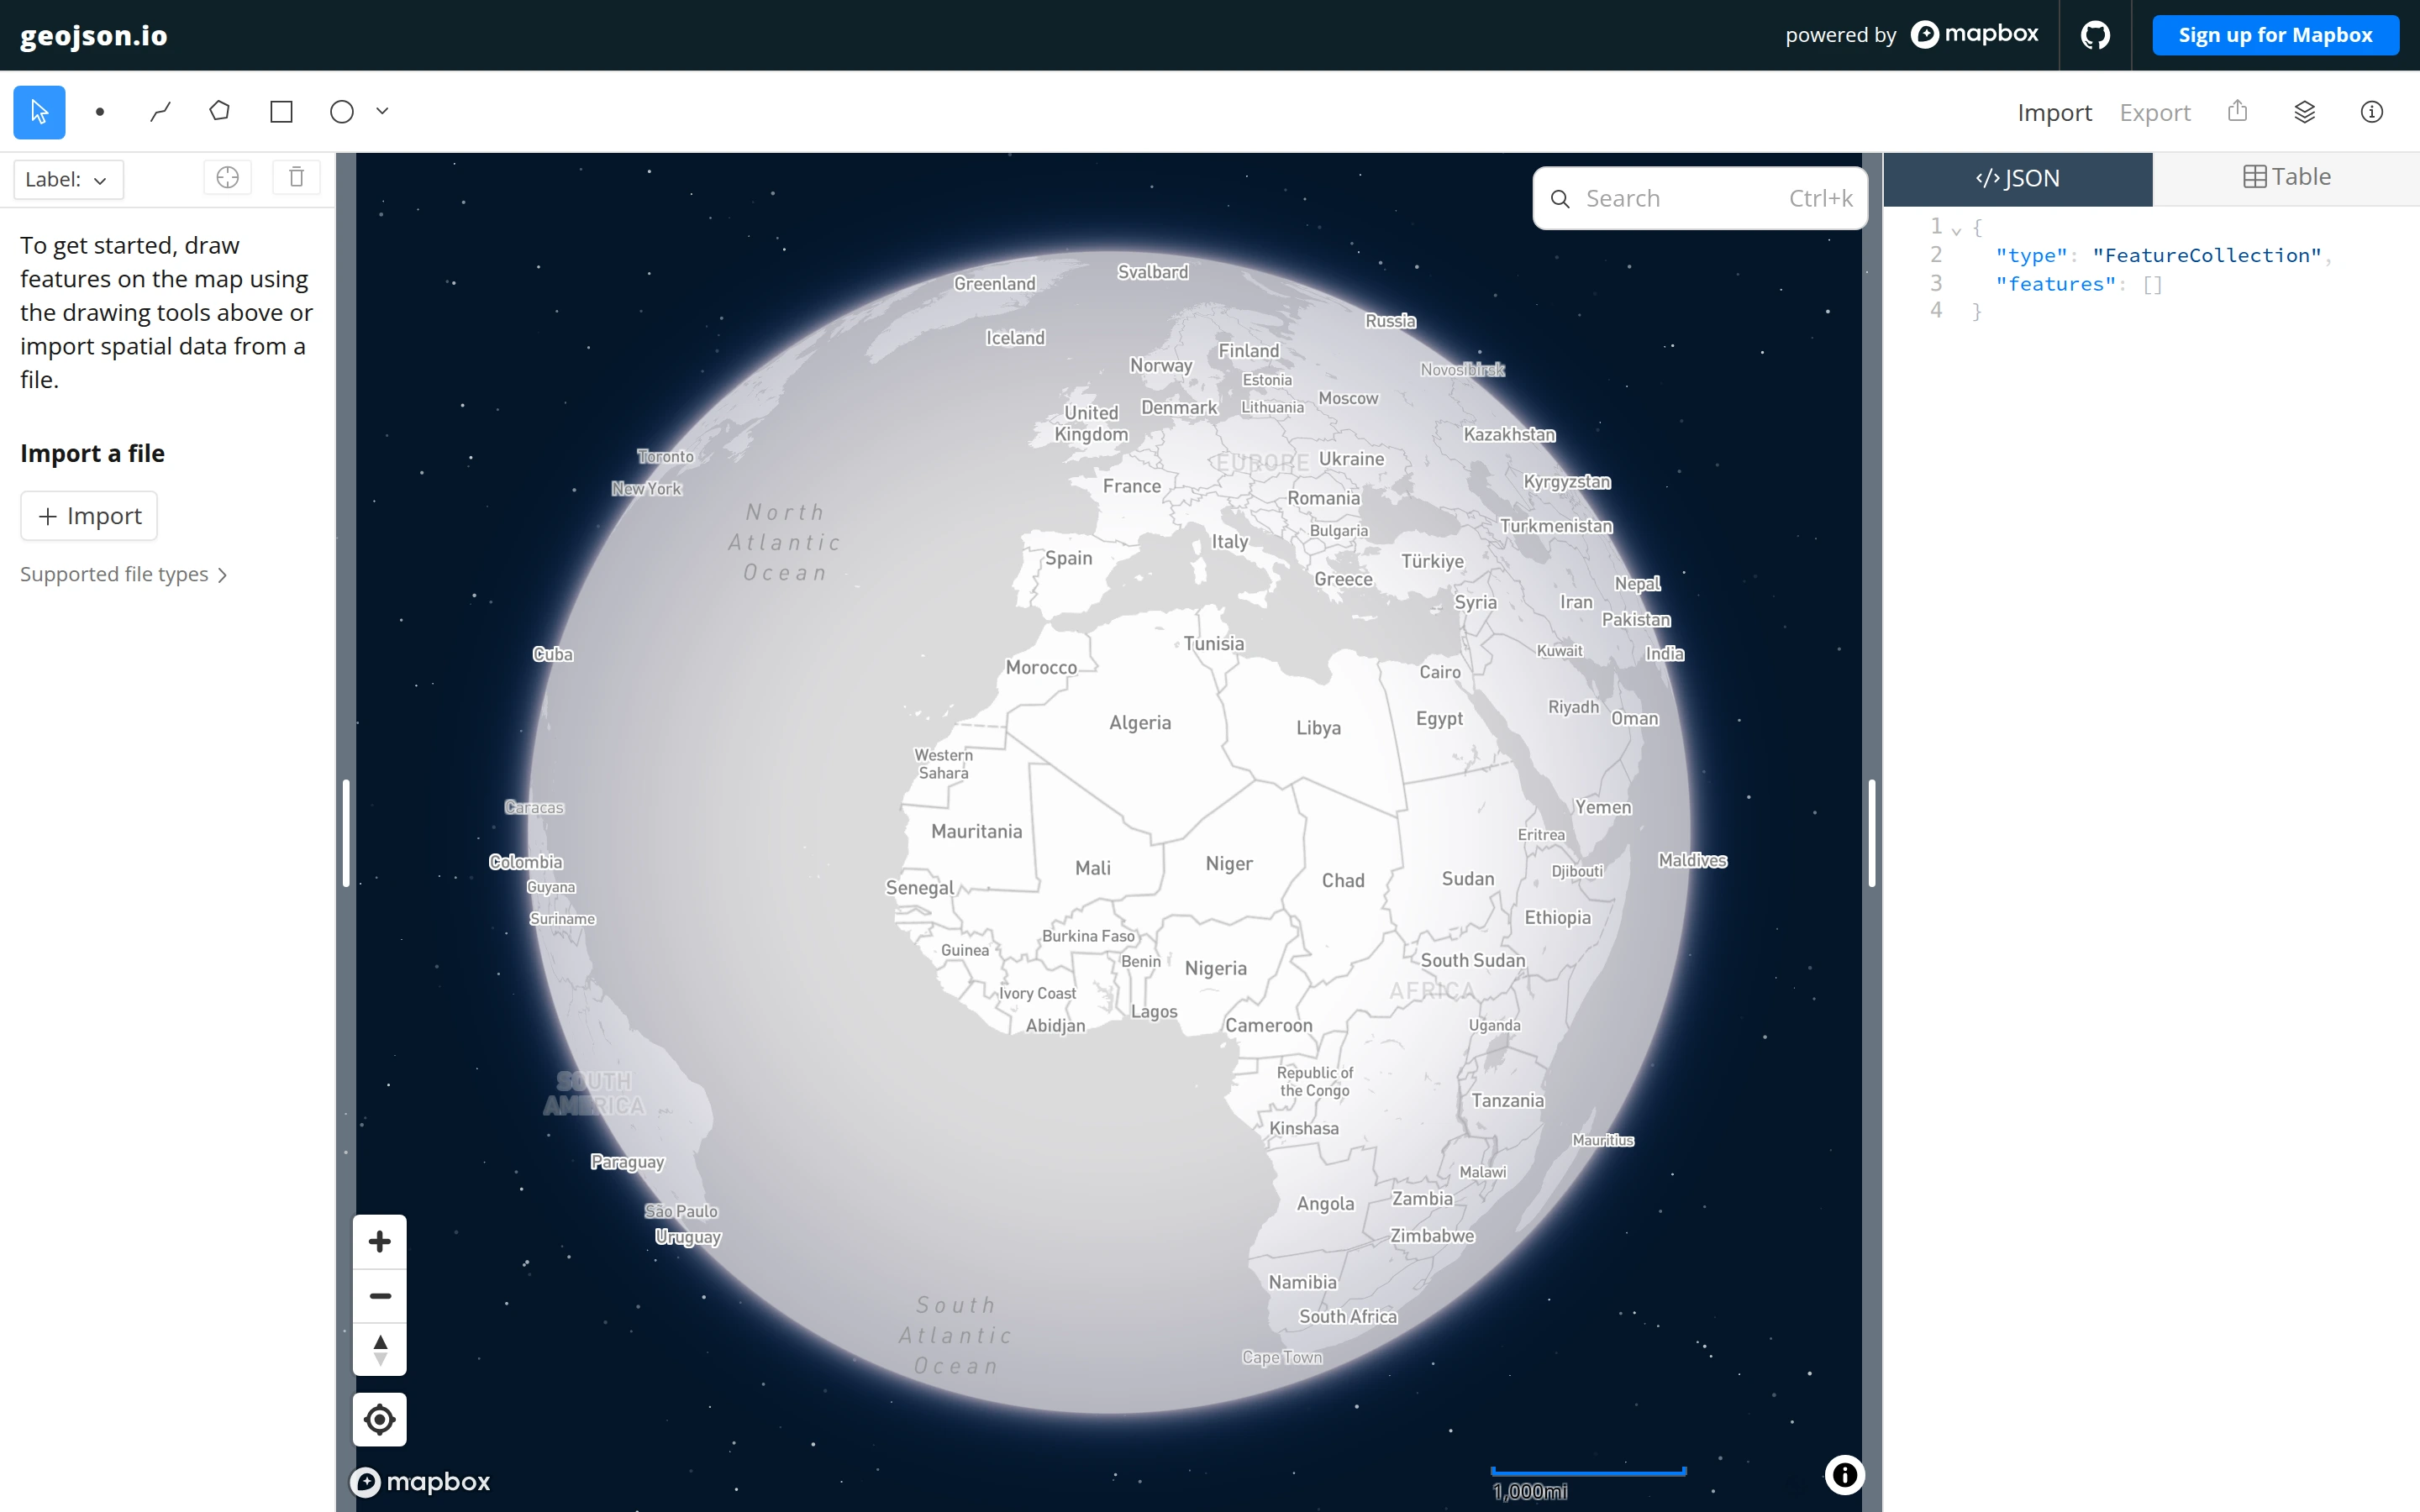
Viewport capture · opening screen Assembled in your browser. No API key or AI request needed. Changing the fields refreshes the preview.
GeoJSON.io — Map and data editor
Analytics & DataSee it livegeojson.io
A globe occupies the central canvas while drawing instructions and editable GeoJSON sit on opposite sides.
Why this pattern works
Pair an interactive map with the corresponding structured data so spatial edits stay understandable.
Design notes
- Surface
- GeoJSON.io — Map and data editor
- Navigation
- Drawing tools run across the top; map controls remain at the canvas edge.
- Layout
- A narrow help column, large map, and right-side code editor show the spatial and textual representations together.
- Density
- Dense controls around a spacious map.
- Color
- Dark blue globe, light land areas, and a white code panel.
- Type
- Small sans-serif labels keep tools and content visually separate.
- Pattern
- Pair an interactive map with the corresponding structured data so spatial edits stay understandable.
- States
- This capture records the visible state only. Loading, error, and later workflow states were not verified.
- Don't
- Adapt the interface pattern with original content, branding, and data; do not infer behavior from a still image.
Make it your own
Turn this reference into a useful brief for your project. Copy it into the AI tool you already use.