← Back to library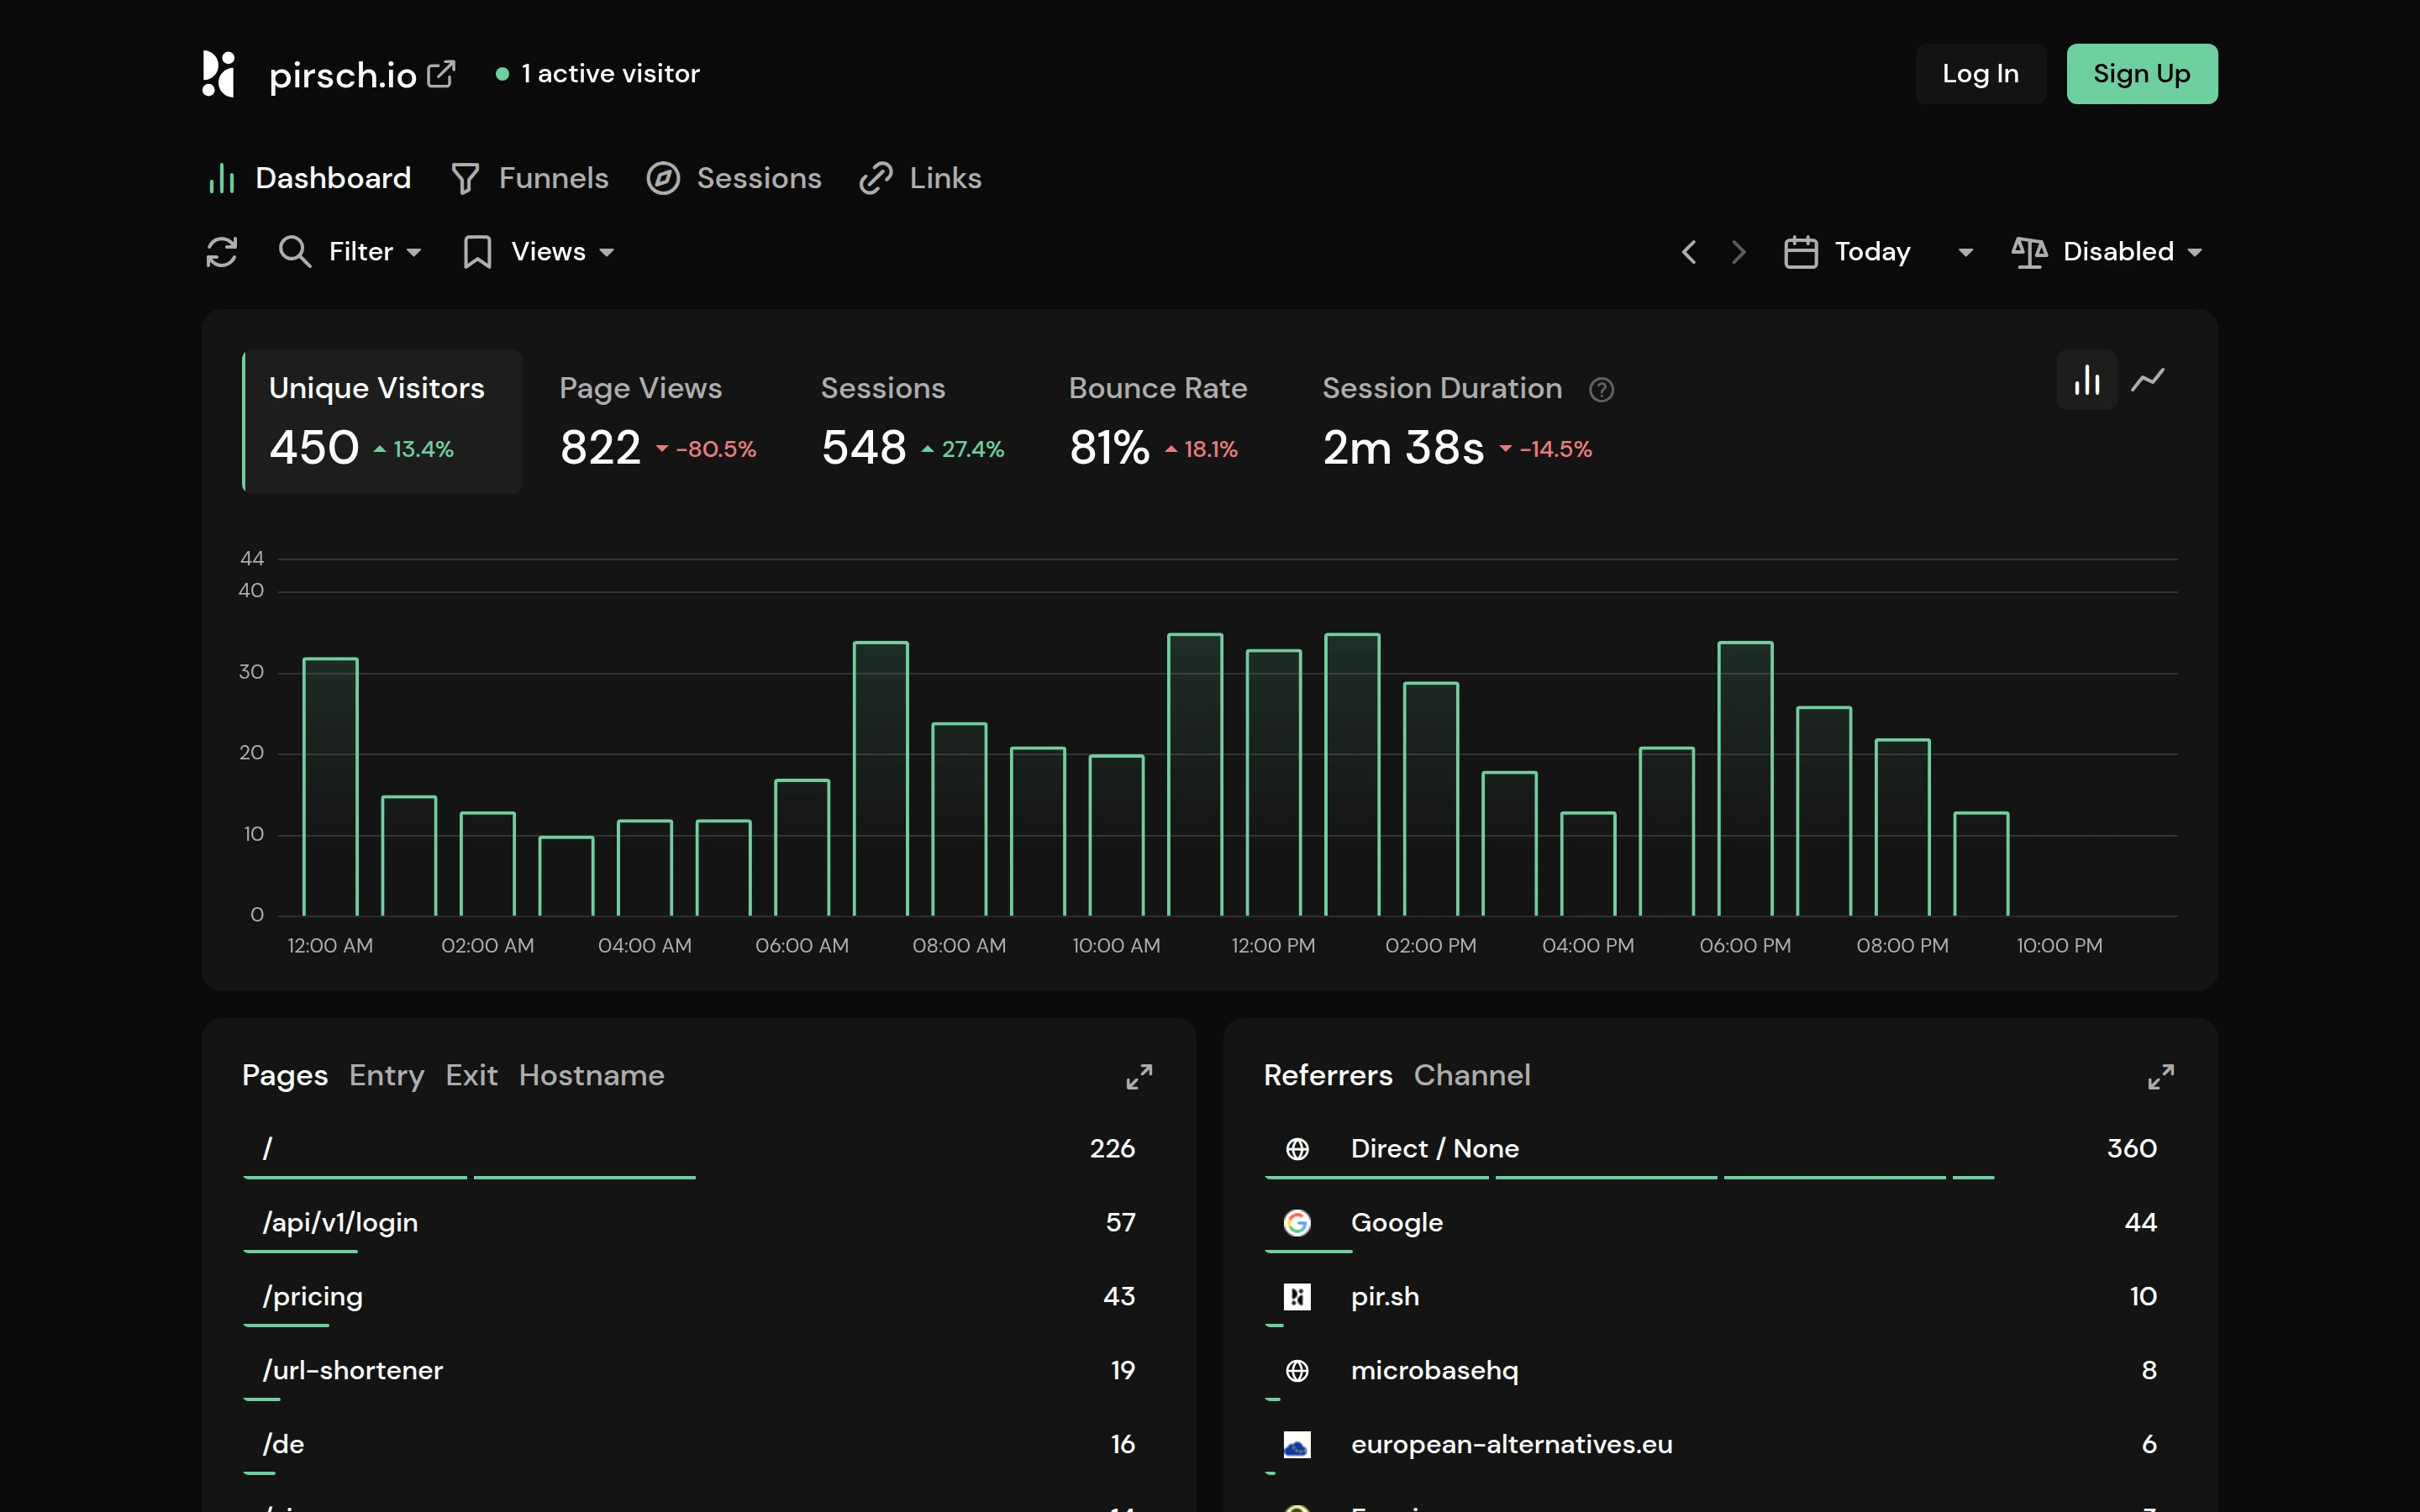
Viewport capture · opening screen Assembled in your browser. No API key or AI request needed. Changing the fields refreshes the preview.
Pirsch — Analytics demo
Analytics & DataSee it livepirsch.pirsch.io
A compact metric strip leads into a green outlined bar chart with page and referrer rankings below.
Why this pattern works
Give a dark analytics view one restrained accent color so trends and active controls share a clear hierarchy.
Design notes
- Surface
- Pirsch — Analytics demo
- Navigation
- Dashboard, funnels, sessions, and links sit in a short horizontal navigation row.
- Layout
- Filters and headline numbers run above the chart, with diagnostic tables underneath.
- Density
- Moderate density with generous separation around the main chart.
- Color
- Near-black canvas, mint-green accents, and white numeric labels.
- Type
- Small sans-serif labels keep tools and content visually separate.
- Pattern
- Give a dark analytics view one restrained accent color so trends and active controls share a clear hierarchy.
- States
- This capture records the visible state only. Loading, error, and later workflow states were not verified.
- Don't
- Adapt the interface pattern with original content, branding, and data; do not infer behavior from a still image.
Make it your own
Turn this reference into a useful brief for your project. Copy it into the AI tool you already use.