← Back to library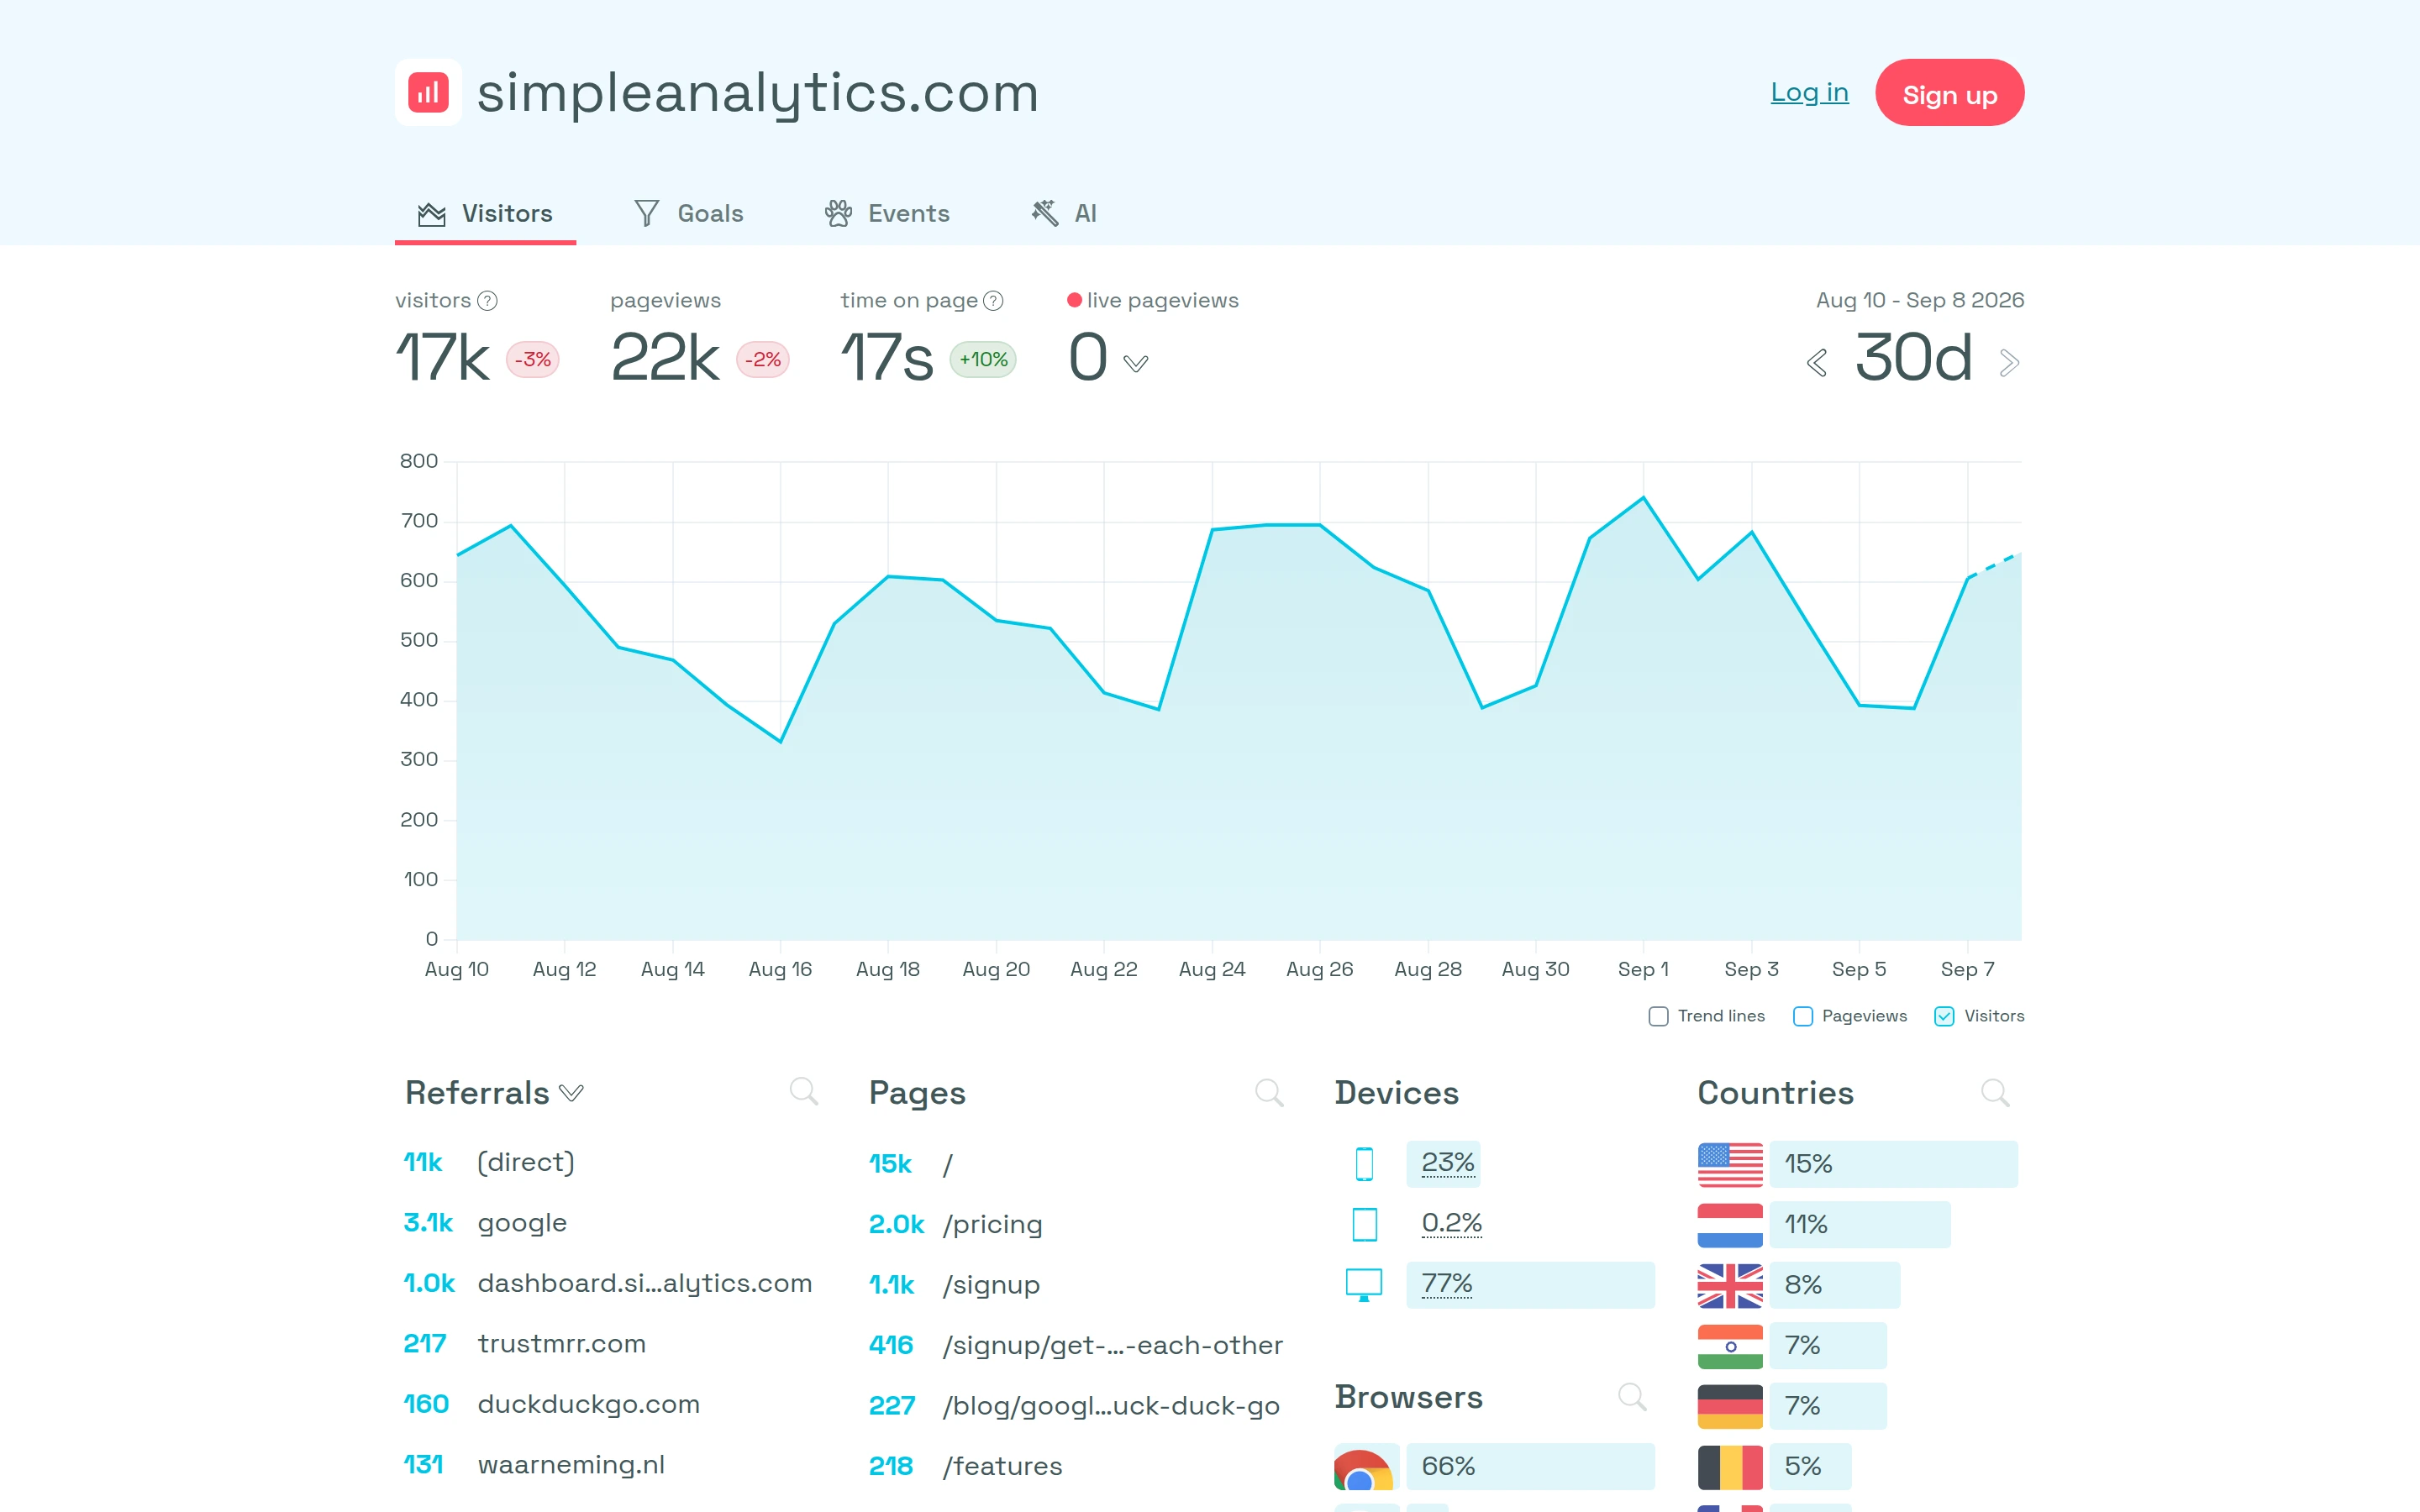
Viewport capture · opening screen Assembled in your browser. No API key or AI request needed. Changing the fields refreshes the preview.
Simple Analytics — Public dashboard
Analytics & DataSee it livedashboard.simpleanalytics.com
A large cyan visitor trend sits above compact referral, page, and device breakdowns.
Why this pattern works
Lead with the traffic trend, then group the main explanatory dimensions directly beneath it.
Design notes
- Surface
- Simple Analytics — Public dashboard
- Navigation
- A short tab row switches between visitors, goals, events, and related views.
- Layout
- Headline statistics and a date selector sit over one wide chart; supporting rankings follow below.
- Density
- Low-to-moderate density with a readable main trend.
- Color
- Light blue canvas, cyan chart fill, and dark gray labels.
- Type
- Small sans-serif labels keep tools and content visually separate.
- Pattern
- Lead with the traffic trend, then group the main explanatory dimensions directly beneath it.
- States
- This capture records the visible state only. Loading, error, and later workflow states were not verified.
- Don't
- Adapt the interface pattern with original content, branding, and data; do not infer behavior from a still image.
Make it your own
Turn this reference into a useful brief for your project. Copy it into the AI tool you already use.