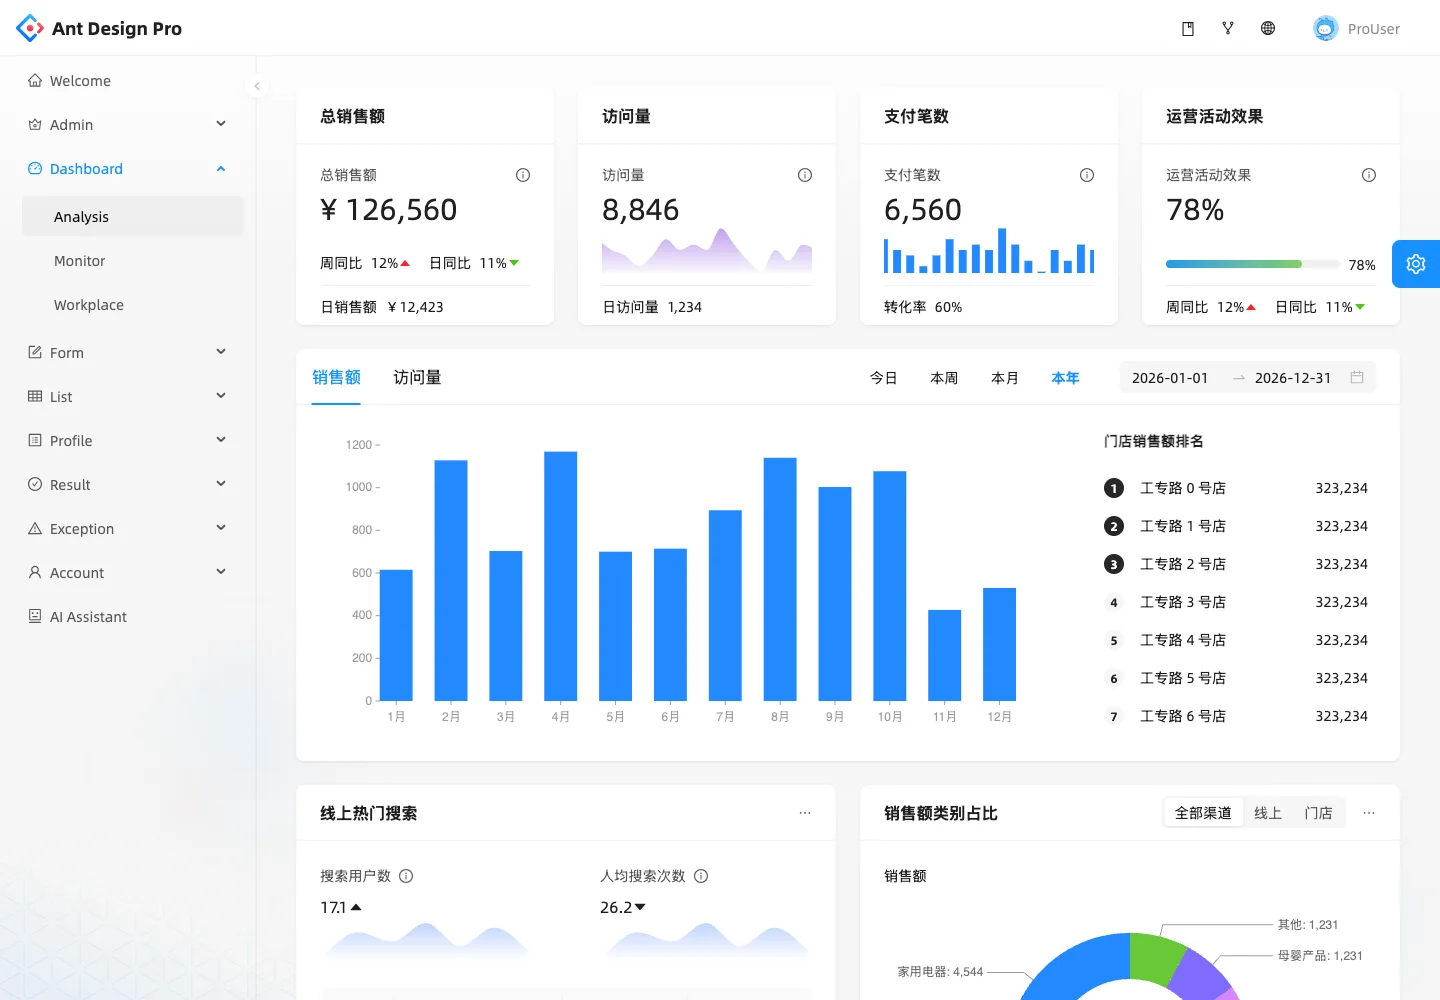
Keep summary, trend, and ranking views together so each explains a different part of performance.
Design notes
Surface
Analysis dashboard
Navigation
A persistent product sidebar frames the screen; date ranges and tabs sit with the data they affect.
Layout
Four summary panels precede a wide sales chart and a side ranking, with secondary charts below.
Density
Headline metrics are spacious; supporting chart labels and rankings use denser alignment.
Color
White panels, blue charts, and distinct small trend indicators.
Type
Use large headline numbers above denser supporting charts and rankings.
Pattern
Keep summary, trend, and ranking views together so each explains a different part of performance.
States
Public Ant Design Pro demo with sample metrics and mixed Chinese and English labels.
Don't
Adapt the interaction pattern to your own product. Do not copy brand assets, sample identities, proprietary text, or assume unseen states. Specify keyboard behavior, loading, empty, error, and narrow-screen layouts for your implementation.
Make it your own
Turn this reference into a useful brief for your project. Copy it into the AI tool you already use.
Add constraintsPreview & edit promptAssembled in your browser. No API key or AI request needed. Changing the fields refreshes the preview.