← Back to library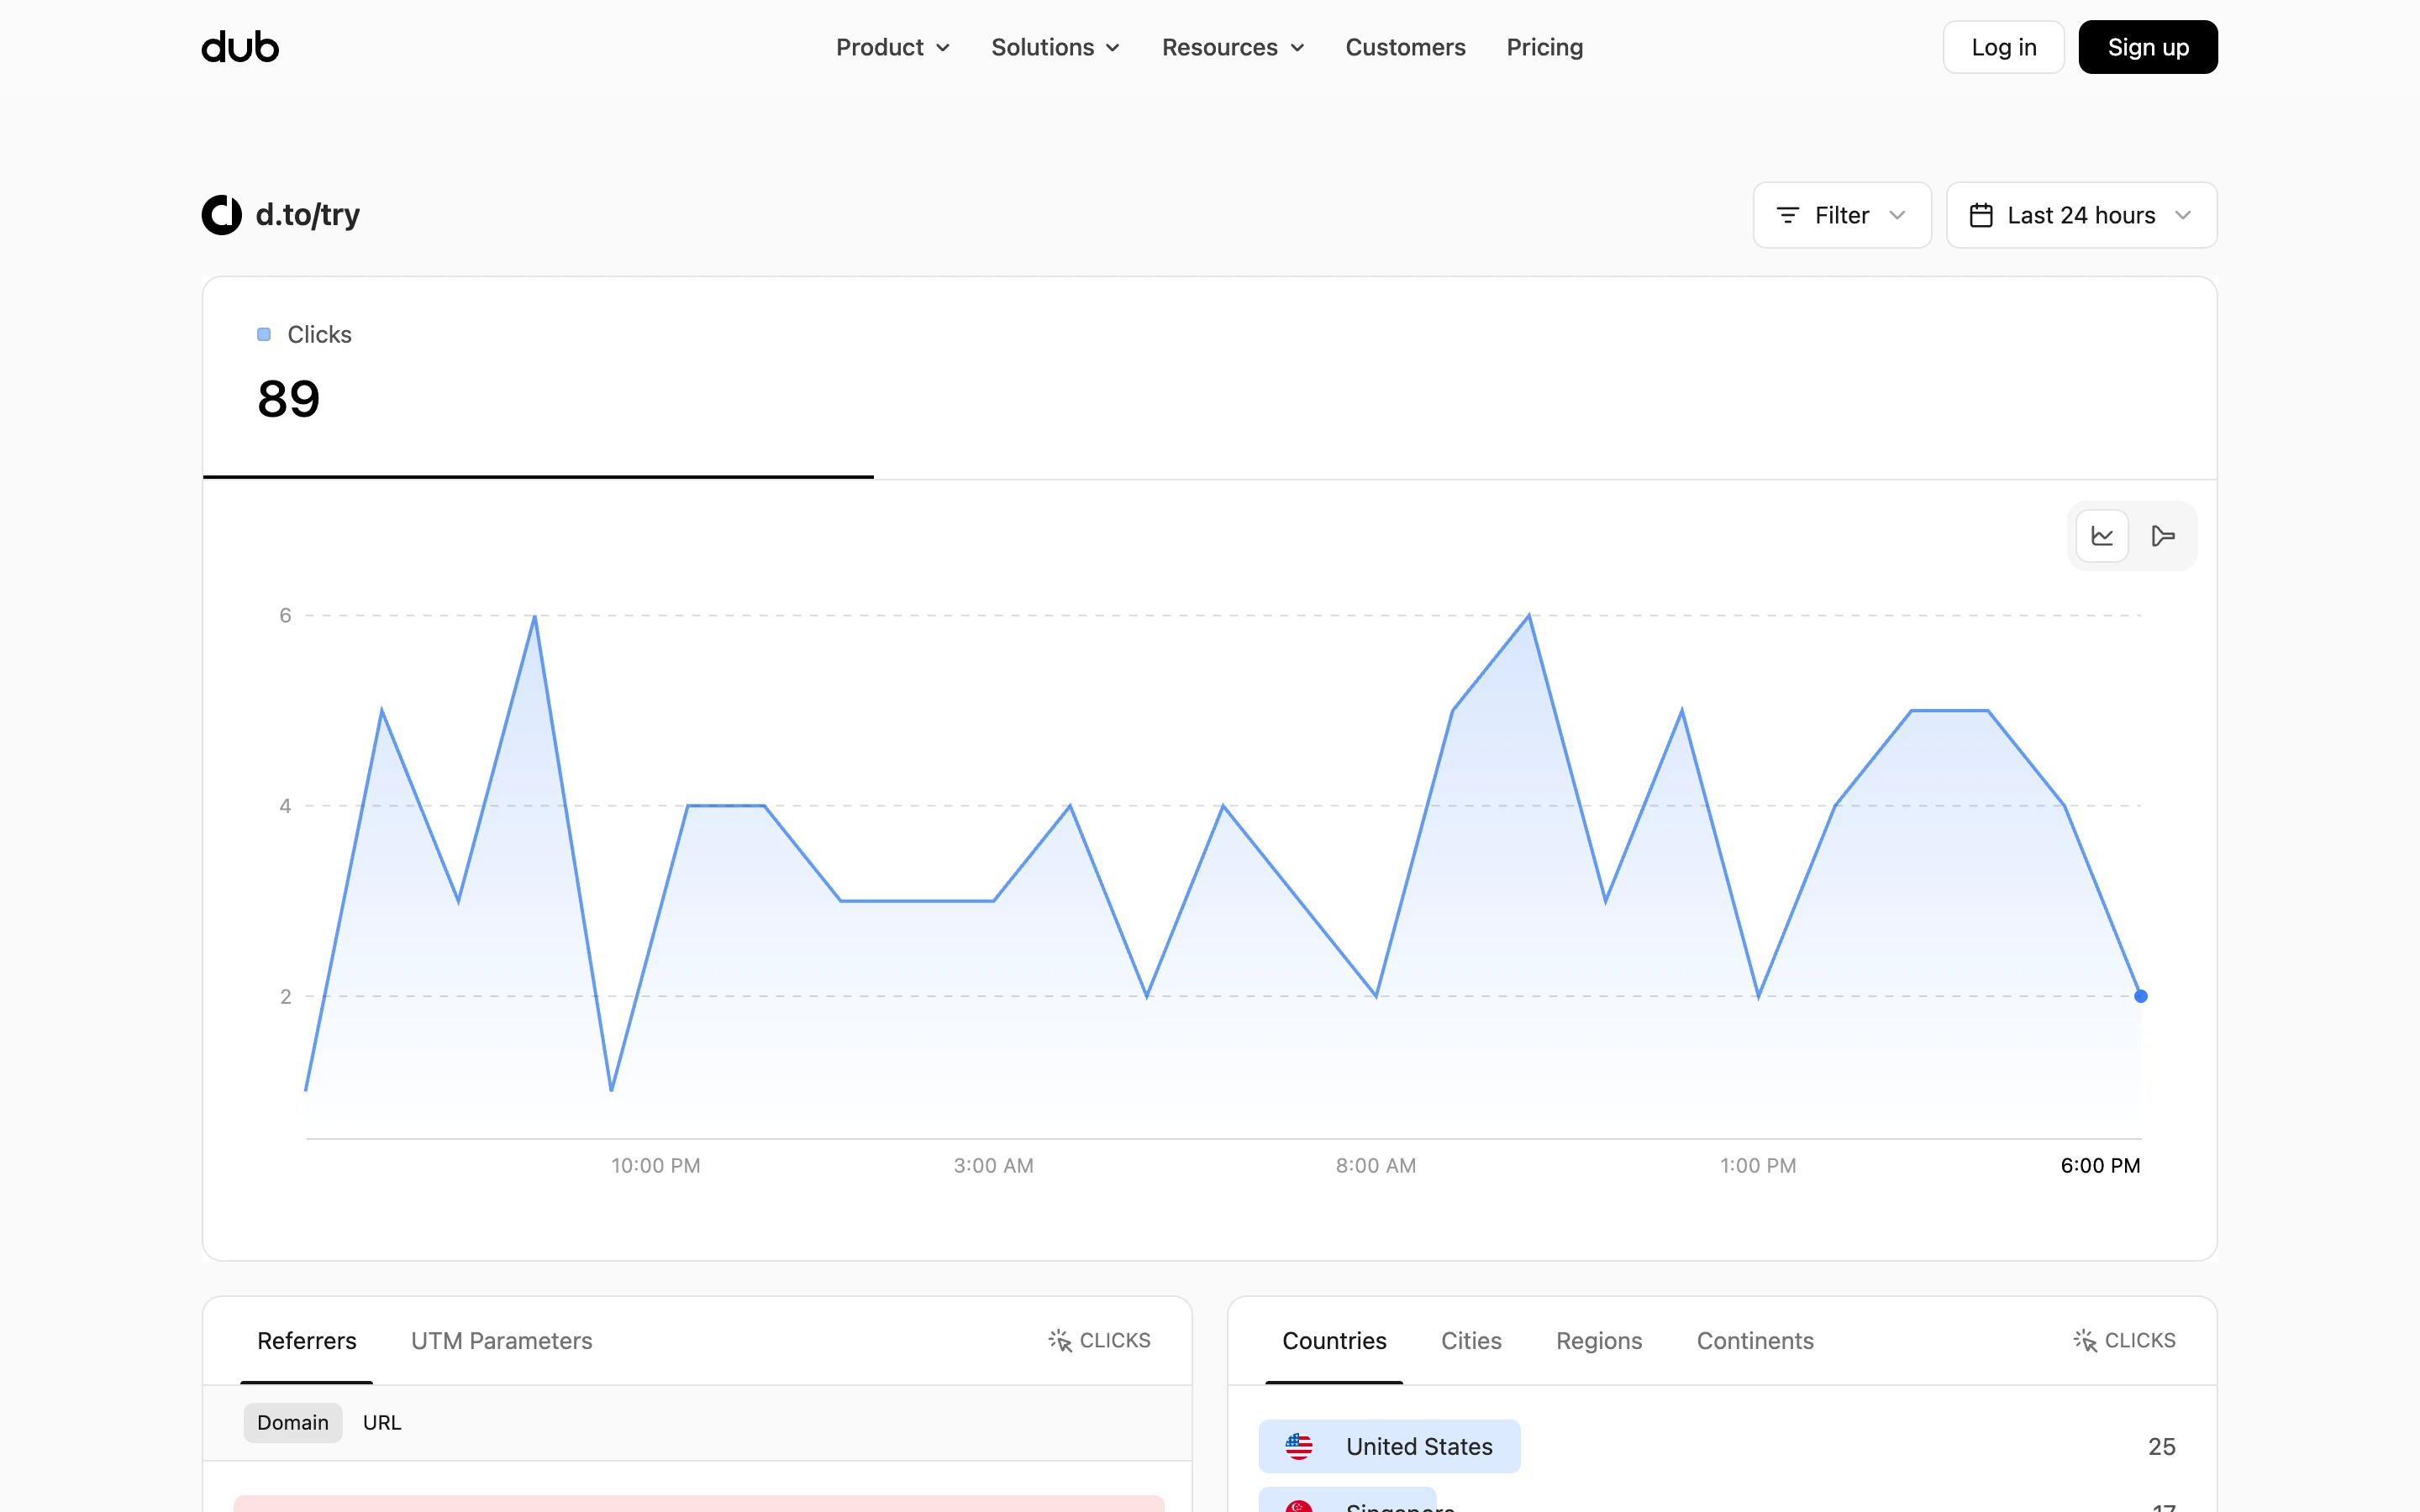
Viewport capture · opening screen Assembled in your browser. No API key or AI request needed. Changing the fields refreshes the preview.
Dub — Shared link analytics
Analytics DashboardSee it liveapp.dub.co
A public link analytics view pairs a single headline metric and trend chart with tabbed breakdowns for referrers, geography, and devices.
Why this pattern works
Public shared analytics for d.to/try, linked from Dub’s live demo.
Design notes
- Surface
- Public shared analytics for d.to/try, linked from Dub’s live demo.
- Navigation
- Top-level site navigation remains above a compact filter and time-range toolbar.
- Layout
- Headline clicks metric, broad trend chart, then two-column breakdown panels.
- Density
- Moderate; a clear overview precedes denser breakdown rows.
- Color
- White and pale gray, dark text, restrained blue chart fill.
- Type
- Compact sans labels and a larger metric.
- Pattern
- Keep time range and filters adjacent to the chart they affect.
- States
- This is a public shared view; data changes over time. Signed-in management and empty/error states were not captured.
- Don't
- Do not confuse a public report with the authenticated analytics workspace.
Make it your own
Turn this reference into a useful brief for your project. Copy it into the AI tool you already use.