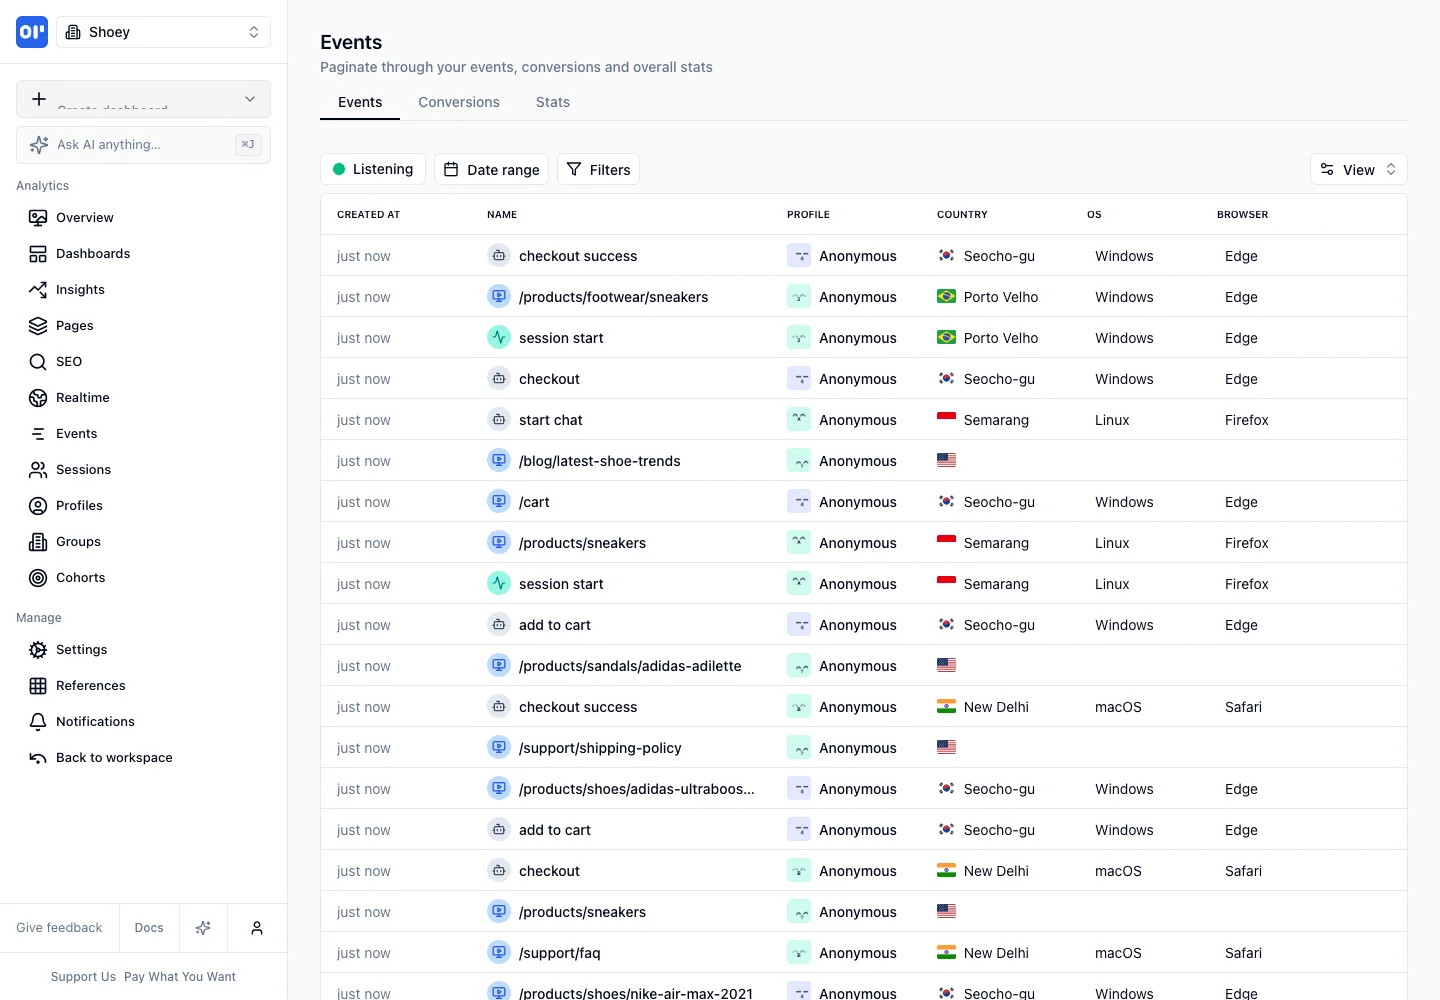
Make operational event data scannable through stable columns, concise labels, and visible stream status.
Design notes
Surface
Event explorer
Navigation
Events, conversions, and stats tabs share a local header with listening status, date range, and filters.
Layout
A wide table fills the workspace under tabs and filter controls beside a persistent navigation rail.
Density
Headline metrics are spacious; supporting chart labels and rankings use denser alignment.
Color
Neutral surfaces, thin row dividers, pastel event-type icons, and a green listening indicator.
Type
Small column headings and aligned timestamps contrast with stronger event names.
Pattern
Make operational event data scannable through stable columns, concise labels, and visible stream status.
States
Populated public demo event table with anonymous sample profiles and recent activity.
Don't
Adapt the interaction pattern to your own product. Do not copy brand assets, sample identities, proprietary text, or assume unseen states. Specify keyboard behavior, loading, empty, error, and narrow-screen layouts for your implementation.
Make it your own
Turn this reference into a useful brief for your project. Copy it into the AI tool you already use.
Add constraintsPreview & edit promptAssembled in your browser. No API key or AI request needed. Changing the fields refreshes the preview.