Keep a searchable schema inventory beside the spatial diagram so users can navigate both structures.
Design notes
Surface
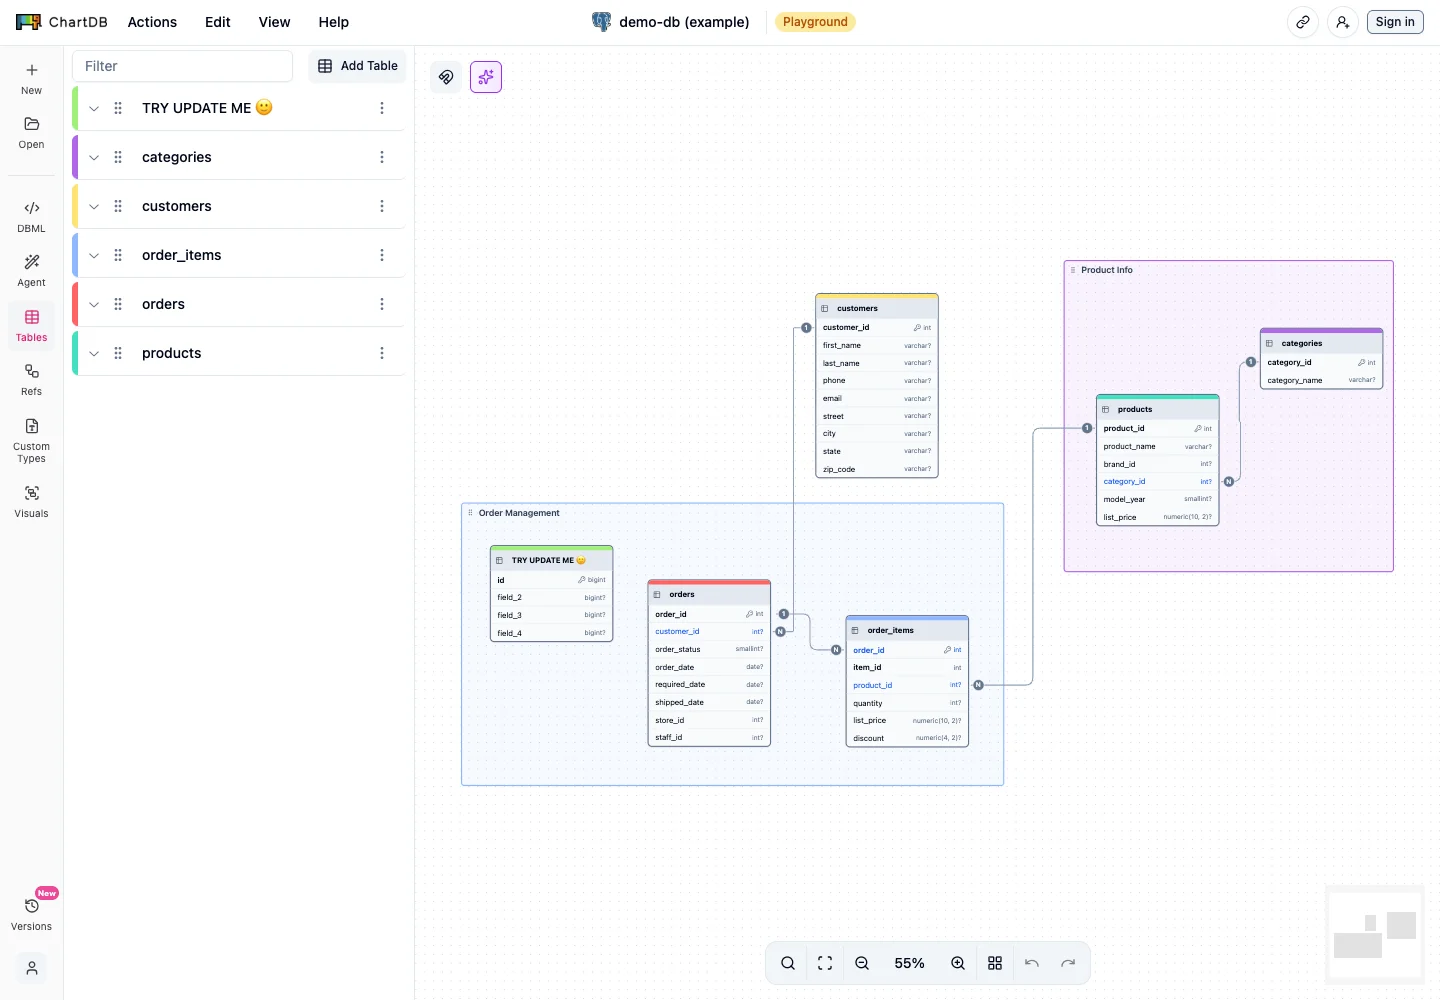
Example database diagram
Navigation
Top menus and sidebar tabs separate diagram actions, table inventory, and other schema tools.
Layout
A narrow table list sits beside linked schema cards on a large canvas, with a small overview map.
Density
The working preview takes most of the space, with compact controls grouped around it.
Color
Light neutral canvas, pastel table accents, and fine relationship connectors.
Type
Compact table headings and aligned field/type rows make dense schemas readable.
Pattern
Keep a searchable schema inventory beside the spatial diagram so users can navigate both structures.
States
Built-in example schema in the public app; no user database imported or connected.
Don't
Adapt the interaction pattern to your own product. Do not copy brand assets, sample identities, proprietary text, or assume unseen states. Specify keyboard behavior, loading, empty, error, and narrow-screen layouts for your implementation.
Make it your own
Turn this reference into a useful brief for your project. Copy it into the AI tool you already use.
Add constraintsPreview & edit promptAssembled in your browser. No API key or AI request needed. Changing the fields refreshes the preview.